| Oracle® Database 2 Day + Performance Tuning Guide 10g Release 2 (10.2) Part Number B28051-01 |
|
|
View PDF |
| Oracle® Database 2 Day + Performance Tuning Guide 10g Release 2 (10.2) Part Number B28051-01 |
|
|
View PDF |
This chapter describes how to resolve performance degradation over time with Oracle Database. Performance degradation of the database over time happens when your database was performing optimally in the past, such as 6 months ago, but has gradually degraded to a point where it becomes noticeable to the users.
The Automatic Workload Repository (AWR) Compare Periods report enables you to compare database performance between two periods of time. While an AWR report shows AWR data between two snapshots (or two points in time), the AWR Compare Periods report shows the difference between two periods (or two AWR reports, which equates to four snapshots).
Using the AWR Compare Periods report helps you to identify detailed performance attributes and configuration settings that differ between two time periods. For example, if the application workload is known to be stable between 10:00 p.m. and midnight every night, but the performance on a particular Thursday was poor between 10:00 p.m. and 11:00 p.m., generating an AWR Compare Periods report for Thursday from 10:00 p.m. to 11:00 p.m. and Wednesday from 10:00 p.m. to 11:00 p.m. should identify configuration settings, workload profile, and statistics that were different in these two time periods. Based on the differences identified, the cause of the performance degradation can be more easily diagnosed. The two time periods selected for the AWR Compare Periods Report can be of different durations, because the report normalizes the statistics by the amount of time spent on the database for each time period, and presents statistical data ordered by the largest difference between the periods.
This chapter contains the following sections:
Running the Automatic Workload Repository Compare Periods Reports
Using the Automatic Workload Repository Compare Periods Reports
Baselines are an effective way to diagnose performance problems. AWR supports the capture of baseline data by enabling you to specify and preserve a pair or a range of snapshots as a baseline. The snapshots contained in a baseline are excluded from the automatic AWR purging process and are retained indefinitely.
Carefully consider the time period you choose as a baseline, because the baseline should represent the system operating at an optimal level. In the future, you can compare these baselines with the snapshots captured during periods of poor performance to analyze performance degradation over time.
On the Database Performance page, under Additional Monitoring Links, click Snapshots.
The Snapshots page appears with a list of the most recent snapshots.
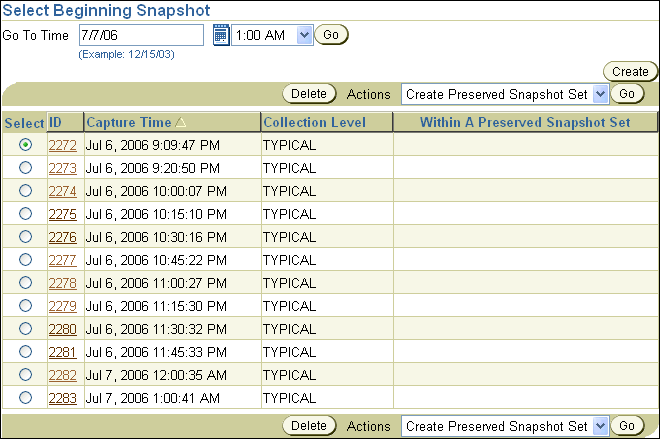
To filter the snapshots and only display the snapshots taken at the start of the desired baseline, select the time for the starting snapshot in the Go To Time field and click Go.
In this example, 12:00AM on July 7, 2006 is selected.

Select the starting snapshot for the baseline.
In this example, snapshot 2282 is selected.
From the Actions list, select Create Preserved Snapshot Set and click Go.
The Create Preserved Snapshot Set page appears with a list of subsequent snapshots displayed. Note that a system generated value is assigned in the Preserved Snapshot Name field.
Under Select Ending Snapshot, select the ending snapshot for the baseline and click OK.
In this example, snapshot 2283 is selected.
After the preserved snapshot set is taken, the Preserved Snapshot Sets page appears with a Confirmation message.
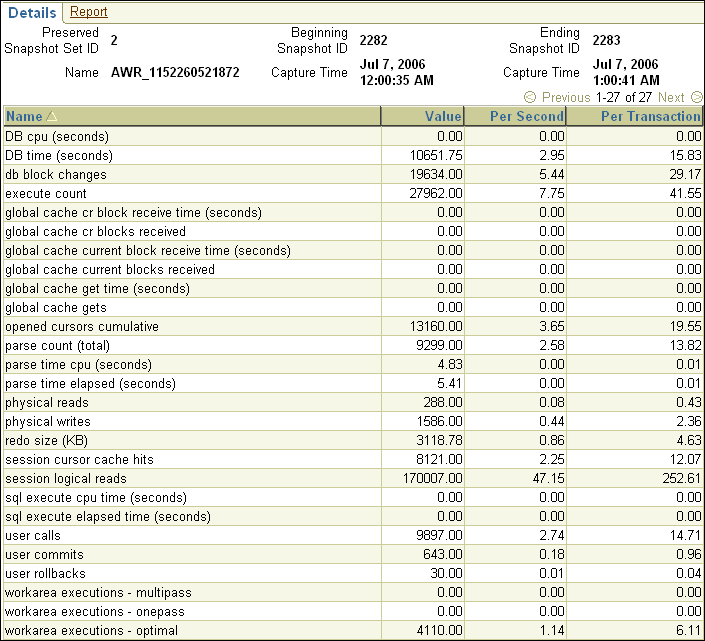
In this example, the preserved snapshot set that was created has a Preserved Snapshot Set ID of 2 and contains snapshots 2282 through 2283.

The preserved snapshot set that was created can now be used as a baseline for comparison to other snapshots when performance problems occur. To view the statistics gathered for this baseline, click the Preserved Snapshot Set ID link.
The Preserved Snapshot Set Details page appears with the statistics gathered for the baseline displayed.
This section describes how to run the AWR Compare Periods reports using Oracle Enterprise Manager.
You can use AWR Compare Periods reports to compare the database performance between two time periods by:
When performance degradation happens to a database over time, you should run the AWR Compare Periods report to compare the degraded performance, captured as a new baseline or a pair of snapshots, to an existing baseline that represents a time when the system was operating at an optimal level. To do so, you will need to have preserved a baseline that represents the system operating at an optimal level. If an existing baseline is not available, you can compare database performance between two periods of time by using two arbitrary pairs of snapshots, as described in "Comparing Two Pairs of Snapshots".
See Also:
To compare a baseline to another baseline:
On the Database Administration page, under Statistics Management, click Automatic Workload Repository.
The Automatic Workload Repository page appears.
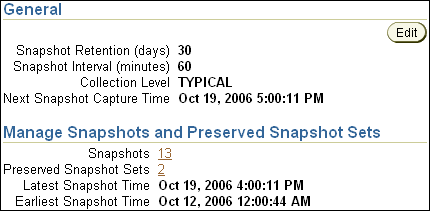
Under Manage Snapshots and Preserved Snapshot Sets, click the link next to Preserved Snapshot Sets.
The Preserved Snapshot Sets page appears.

Select the baseline you want to use for the report. At least one existing preserved snapshot set must be available to be used as a baseline.
From the Actions list, select Compare Periods and click Go.
The Compare Periods: Second Period Start page appears. Under First Period, the selected baseline is displayed. In this example, the baseline named AWR_BASELINE_2006 is selected.

You can compare the baseline selected in the first period to another baseline or a pair of snapshots.
To compare to another baseline, select Select a Preserved Snapshot Set and then the baseline you want to use in the second period.
In this example, the preserved snapshot set named AWR_20061019 is selected.

Click Next. The Compare Periods: Review page appears. Proceed to Step 6.
To compare to a pair of snapshots, select Select Beginning Snapshot and then the beginning snapshot you to use in the second period.
In this example, snapshot 3693, taken on October 19, 2006 at 2:00 p.m., is selected.
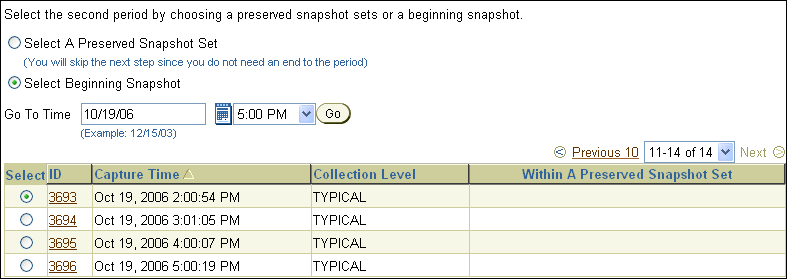
Click Next. The Compare Periods: Second Period End page appears. Continue with the next step.
Select the ending snapshot for the snapshot period that will be included in the report and click Next.
In this example, snapshot 3696, taken on October 19, 2006 at 5:00 p.m., is selected.

The Compare Periods: Review page appears.

Review the selected periods that will be included in the report and click Finish.
The Compare Periods: Results page appears. Data from the selected periods appears under the General subpage. Data can be viewed per second or per transaction by selecting the desired option from the View Data list.
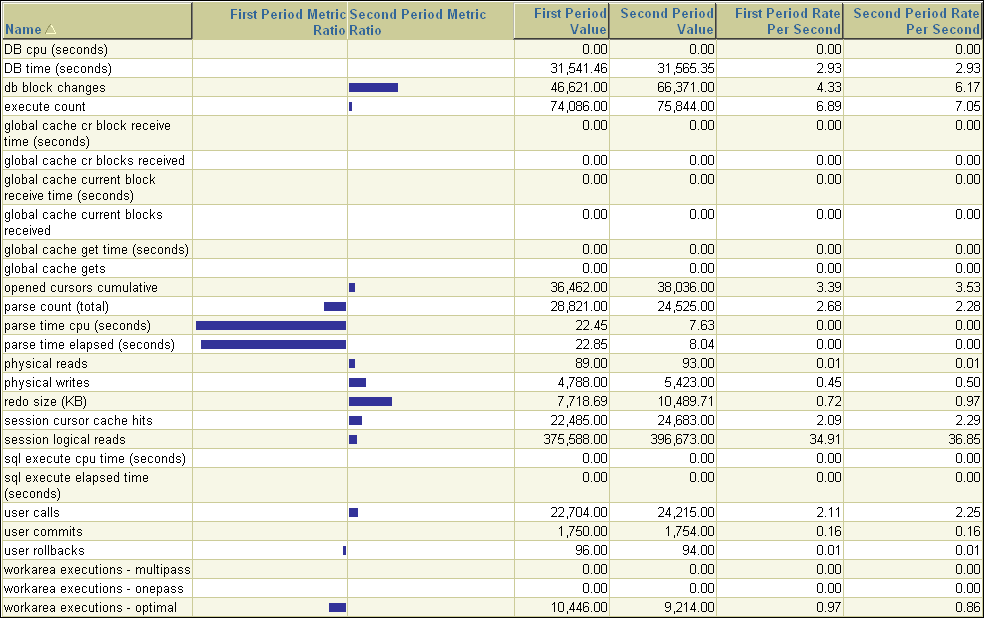
In this example, parse time in the first period is much higher than the second.
To view the report, click the Report tab.
The Processing: View Report page appears while the report is being generated. After it completes, the report will appear, as shown in Figure 8-1. To change periods, click Change Periods. To save the report as an HTML file, click Save to File.
If an existing baseline is not available, you can compare the database performance using two arbitrary pairs of snapshots, one pair taken when the database is performing optimally, and another pair when the database is performing poorly.
To compare performance using two pairs of snapshots:
On the Database Administration page, under Statistics Management, click Automatic Workload Repository.
The Automatic Workload Repository page appears.
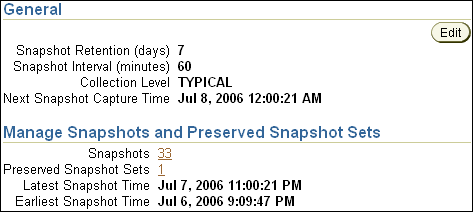
Under Manage Snapshots and Preserved Snapshot Sets, click the link next to Snapshots.
The Snapshots page appears. At least four existing snapshots must be available.
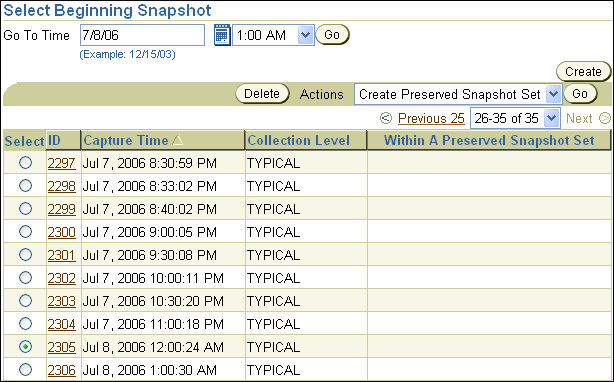
To filter the snapshots and display only the snapshot taken at the start of the comparison period, in the Go To Time field, select the time for the starting snapshot and click Go.
In this example, 10:00 p.m. on Thursday, July 6, 2006, is selected.
Under Select Beginning Snapshot, select the starting point for the first snapshot period that will be included in the report.
In this example, snapshot 2274, taken on Thursday, July 6, 2006 at 10:00 p.m., is selected.

From the Actions list, select Compare Periods and click Go.
The Compare Periods: First Period End page appears.
Select the ending point for the first snapshot period that will be included in the report and click Next.
In this example, snapshot 2278, taken on Thursday, July 6, 2006 at 11:00 p.m., is selected.

The Compare Periods: Second Period Start page appears.
Select the starting point for the second snapshot period that will be included in the report and click Next.
In this example, snapshot 2302, taken on Friday, July 7, 2006 at 10:00 p.m., is selected.
The Compare Periods: Second Period End page appears.
Select the end point for the second period that will be included in the report and click Next.
In this example, snapshot 2304, taken on Friday, July 7, 2006 at 11:00 p.m., is selected.

The Compare Periods: Review page appears.

Review the selected periods that will be included in the report and click Finish.
The Compare Periods: Results page appears. Data from the selected periods appears under the General subpage. Data can be viewed per second or per transaction by selecting the desired option from the View Data list.
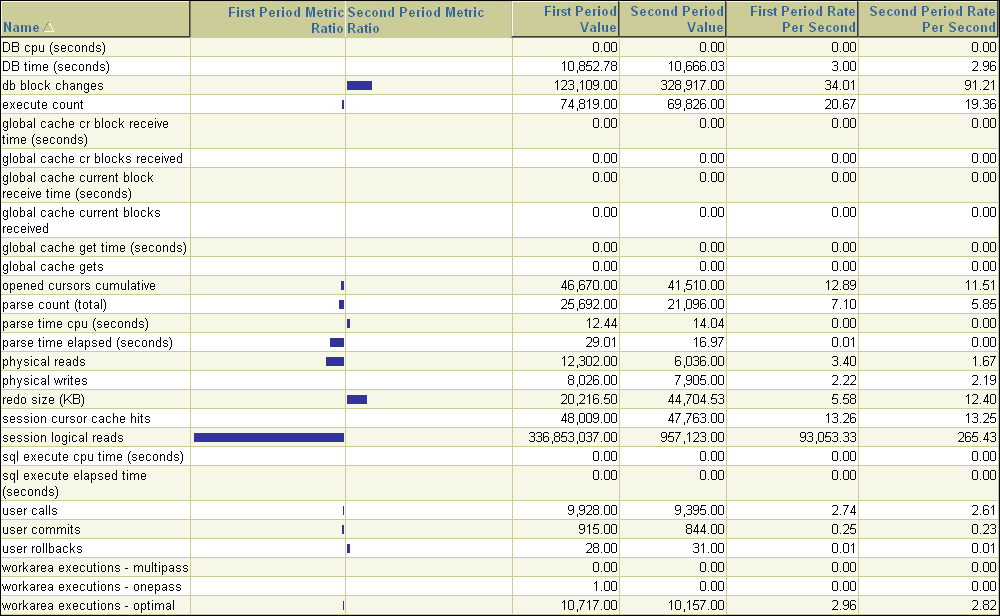
In this example, logical reads in the first period are much higher than the second.
To view the report, click the Report tab.
The Processing: View Report page appears while the report is being generated. After it completes, the report will appear, as shown in Figure 8-1. To change periods, click Change Periods. To save the report as an HTML file, click Save to File.
After an AWR Compare Periods report is generated for the time periods you want to compare, you can use it to perform an analysis of performance degradation with Oracle Database that may have happened over time. For information about generating AWR Compare Periods reports, see "Running the Automatic Workload Repository Compare Periods Reports".
Figure 8-1 shows an example of an AWR Compare Periods report.
The contents of the AWR Compare Periods report are divided into the following sections:
The report summary is at the beginning of the AWR Compare Periods report, and summarizes information about the snapshot sets and loads used in the report. The report summary contains the following sections:
The Snapshot Sets section, shown in Figure 8-2, displays information about the snapshot sets used for this report, such as instance, host, and snapshot information.
In this example, the first snapshot period corresponds to the time when performance degradation was experienced on July 6, 2006 from 10:00 p.m. to 11:00 p.m. The second snapshot period represents a time when performance was stable on July 7, 2006 from 10:00 p.m. to 11:00 p.m.
The Configuration Comparison section compares the configurations used in the two snapshot sets. Any differences in the configurations are quantified as percentages differed in the %Diff column.
The Load Profile section compares the loads used in the two snapshot sets. Any differences in the loads are quantified as percentages differed in the %Diff column.
The Top 5 Timed Events section, shown in Figure 8-3, displays the five events or operations that consumed the most CPU time (represented as a percentage of total DB time) in each of the snapshot sets.
In this example, CPU time is much higher in the first period than in the second. Waits for the db file sequential read event is also significantly higher in the first period than in the second.
The Wait Events section, shown in Figure 8-4, compares the wait events in the two snapshot sets. The wait events are ordered based on the difference in total DB time spent on the wait event between the two snapshot sets, and are listed in descending order. Wait events at the top of this section have the greatest differential between the two snapshot sets, and may be possible causes for performance degradation over time.
In this example, the wait time for several events is much higher in the first period than in the second, such as db file sequential read, db file scattered read, latch free, and buffer busy waits.
See Also:
The Time Model Statistics section, shown in Figure 8-5, compares time model statistics in the two snapshot sets. The time model statistics are ordered based on the difference in total DB time spent on a particular type of operation between the two snapshot sets, and are listed in descending order. Time model statistics at the top of this section have the greatest differential between the two snapshot sets, and the related operations may be possible causes for performance degradation over time.
In this example, several statistics are much higher in the first period than in the second, such as DB time, DB CPU, and sql execute elapsed time. This information suggests that the majority of the database activity and CPU utilization are being used by the execution of SQL statements. The SQL Statistics section should be analyzed next to determine if a particular SQL statement is causing the performance degradation.
See Also:
The Operating System Statistics section compares operating system statistics in the two snapshot sets. This section provides an overall state of the operating system during each of the two periods being compared.
The Service Statistics section compares services in the two snapshot sets. The services are ordered based on the difference in total DB time spent on a particular service between the two snapshot sets, and are listed in descending order.
The SQL Statistics section compares the top SQL statements in the two snapshot sets. The SQL statements are ordered based on different comparison methods, but in all cases, the top ten SQL statements with the greatest differential between the two snapshot sets are shown. These SQL statements may be possible causes for performance degradation over time, and are ordered based on the following categories:
SQL statements in this section are ordered based on the difference in total DB time spent processing the SQL statement between the two snapshot sets and are listed in descending order, as shown in Figure 8-6.
Figure 8-6 Top 10 SQL Comparison by Execution Time

In this example, the time it took to execute the top two SQL statements consumed 87.93 percent of DB time in the first period, but not in the second. These two SQL statements are likely the high-load SQL statements that caused the performance degradation in the first period and should be investigated. Review the SQL statements in the Complete List of SQL Text subsection of the report and tune them, if necessary.
See Also:
Chapter 10, "Tuning SQL Statements" for information about tuning SQL statements
SQL statements in this section are ordered based on the difference in CPU time spent processing the SQL statement between the two snapshot sets, and are listed in descending order.
SQL statements in this section are ordered based on the difference in the number of total buffer cache reads or buffer gets made when processing the SQL statement between the two snapshot sets, and are listed in descending order.
SQL statements in this section are ordered based on the difference in the number of physical reads made when processing the SQL statement between the two snapshot sets, and are listed in descending order.
SQL statements in this section are ordered based on the difference in the number of executions per second (based on DB time) when processing the SQL statement between the two snapshot sets, and are listed in descending order.
SQL statements in this section are ordered based on the difference in the number of total parses made when processing the SQL statement between the two snapshot sets, and are listed in descending order. Parsing is one stage in the processing of a SQL statement. When an application issues a SQL statement, the application makes a parse call to Oracle Database. Making parse calls can greatly affect the performance of a database and should be minimized as much as possible.
See Also:
Oracle Database Concepts for information about parsing
The Instance Activity Statistics section compares the statistic values of instance activity between the two snapshot sets. For each statistic, the value of the statistic is shown along with the differentials measured by DB time, elapsed time, and per transaction.
The instance activity statistics are categorized into the following sections:
As the name suggests, the Key Instance Activity Statistics section displays the difference in key instance activity statistic values between the two snapshot sets.
The Other Instance Activity Statistics sections displays the difference in instance activity for all other statistics between the two snapshot sets.
The I/O Statistics section compares the I/O operations performed on tablespaces and database files between the two snapshot sets. A drastic increase in I/O operations between the two snapshots may be the cause of performance degradation over time.
For each tablespace or database file, the difference in the number of reads, writes, and buffer cache waits (or buffer gets) are quantified as a percentage. The database files are ordered based on different comparison methods, but in all cases, the top 10 database files with the greatest differential between the two snapshot sets are shown.
I/O statistics comparison are divided into the following categories:
Tablespaces in this section are ordered by the difference in the number of normalized I/Os performed on the tablespace between the two snapshot sets, and are listed in descending order. Normalized I/Os are the sum of average reads and writes per second.
Database files in this section are ordered by the difference in the number of normalized I/Os performed on the database file between the two snapshot sets, and are listed in descending order. Normalized I/Os are the sum of average reads and writes per second.
Database files in this section are ordered by the difference in the percentage of DB time spent reading data from the database file between the two snapshot sets, and are listed in descending order.
The Advisory Statistics section compares program global area (PGA) memory statistics between the two snapshot sets, and is divided into the following categories:
The PGA Aggregate Summary section compares the PGA cache hit ratio between the two snapshot sets.
The Wait Statistics section compares statistics for buffer waits and enqueues between the two snapshot sets.
Wait statistics are divided into the following categories:
The Buffer Wait Statistics section compares buffer waits between the two snapshot sets. Buffer waits happen during a free buffer lookup in the buffer cache.
The Enqueue Activity section compares enqueue activities between the two snapshot sets. Enqueues are shared memory structures (or locks) that serialize access to database resources and can be associated with a session or transaction.
See Also:
Oracle Database Reference for information about enqueues
The Latch Statistics section compares the number of total sleeps for latches between the two snapshot sets in descending order.
Latches are simple, low-level serialization mechanisms to protect shared data structures in the system global area (SGA). For example, latches protect the list of users currently accessing the database and the data structures describing the blocks in the buffer cache. A server or background process acquires a latch for a very short time while manipulating or looking up one of these structures. The implementation of latches is operating system dependent, particularly in regard to whether and how long a process will wait for a latch.
See Also:
Oracle Database Performance Tuning Guide for information about latches
The Segment Statistics section compares segments, or database objects (such as tables and indexes), between the two snapshot sets. The segments are ordered based on different comparison methods, but in all cases the top five segments with the greatest differential between the two snapshot sets are shown. These segments may be the causes of performance degradation over time, and are ordered based on the following categories:
Segments in this section, shown in Figure 8-7, are ordered based on the difference in the number of logical reads (total number of reads from disk or memory) performed on the segment between the two snapshot sets, and are listed in descending order.
Figure 8-7 Top 5 Segments Comparison by Logical Reads

In the example, an extremely high percentage of logical reads are made on the CUSTOMERS table in the first period. Depending on the investigation of the high-load SQL statements, data access to this table may need to be tuned using an index or a materialized view.
See Also:
Chapter 11, "Optimizing Data Access Paths" for information about creating indexes and materialized views
Segments in this section are ordered based on the difference in the number of physical reads (such as disk reads) performed on the segment between the two snapshot sets, and are listed in descending order.
Segments in this section are ordered based on the difference in the number of waits on row locks for the segment between the two snapshot sets, and are listed in descending order. Row-level locks are primarily used to prevent two transactions from modifying the same row. When a transaction needs to modify a row, a row lock is acquired.
See Also:
Oracle Database Concepts for information about row locks
Segments in this section are ordered based on the difference in the number of interested transaction list (ITL) waits for the segment between the two snapshot sets, and are listed in descending order.
See Also:
Oracle Database Performance Tuning Guide for information about ITL waits
Segments in this section are ordered based on the difference in the number of buffer busy waits for the segment between the two snapshot sets, and are listed in descending order.
See Also:
Oracle Database Performance Tuning Guide for information about buffer busy waits
The Dictionary Cache Statistics section compares the number of get requests performed on the dictionary cache between the two snapshot sets in descending order. The difference is measured by the number of get requests per second of both total DB time and elapsed time. The dictionary cache is a part of the SGA that stores information about the database, its structures, and its users. The dictionary cache also stores descriptive information (or metadata) about schema objects, which is accessed by Oracle Database during the parsing of SQL statements.
See Also:
Oracle Database Performance Tuning Guide for information about the dictionary cache
The Library Cache Statistics section compares the number of get requests performed on the library cache between the two snapshot sets in descending order. The difference is measured by the number of get requests per second of both total DB time and elapsed time. The library cache is a part of the SGA that stores table information, object definitions, SQL statements, and PL/SQL programs.
See Also:
Oracle Database Performance Tuning Guide for information about the library cache
The SGA Statistics section compares SGA memory statistics between the two snapshot sets, and is divided into the following categories:
The SGA Memory Summary section summarizes the SGA memory configurations for the two snapshot sets.