| Oracle® OLAP Application Developer's Guide, 10g Release 2 (10.2.0.3) Part Number B14349-03 |
|
|
View PDF |
| Oracle® OLAP Application Developer's Guide, 10g Release 2 (10.2.0.3) Part Number B14349-03 |
|
|
View PDF |
In Analytic Workspace Manager, you can create forecasts, set goals, and create budgets at a high level, and then allocate those numbers down a hierarchy to see how those numbers impact the contributing values.
This chapter contains the following topics:
Allocations distribute aggregate level data to detail level data, sometimes using an existing set of data as the basis for the allocation. This technology is often used in forecasting and budgeting systems. An example of a financial allocation is the automated distribution of a bonus pool, based on the current salaries and performance ratings of the employees.
You can think of allocations as inverse aggregations.
In aggregations, a group of child values are aggregated into a single parent value using an aggregation method, such as Sum.
In allocations, a parent value is distributed to a group of child cells using an allocation method that is the inverse of the aggregation method, such as Average.
One important difference between aggregation and allocation is that an aggregation has one defined answer. An allocation has many possible answers for the same source value.
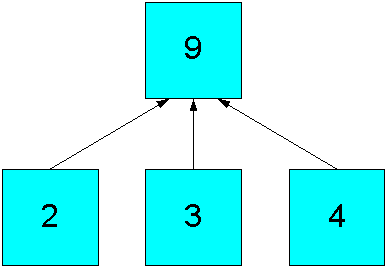
For example, consider the hierarchy in Figure 8-1. The value 9 is derived by aggregating the values 2, 3 and 4 using the Sum operator.
Figure 8-1 Aggregation in a Simple Hierarchy
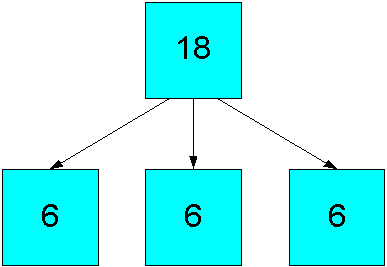
Now change the value of 9 to 18 and allocate the results to the children. The Even allocation operator divides the source value evenly by the number of children, and so assigns each child a value of 6, as shown in Figure 8-2.
Figure 8-2 Even Allocation In a Simple Hierarchy
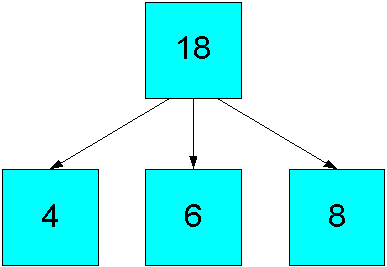
In contrast, the Proportional allocation operator divides the value into proportions based on the current value of each target cell, and so assigns values of 4, 6 and 8, as shown in Figure 8-3.
Figure 8-3 Proportional Allocation In a Simple Hierarchy
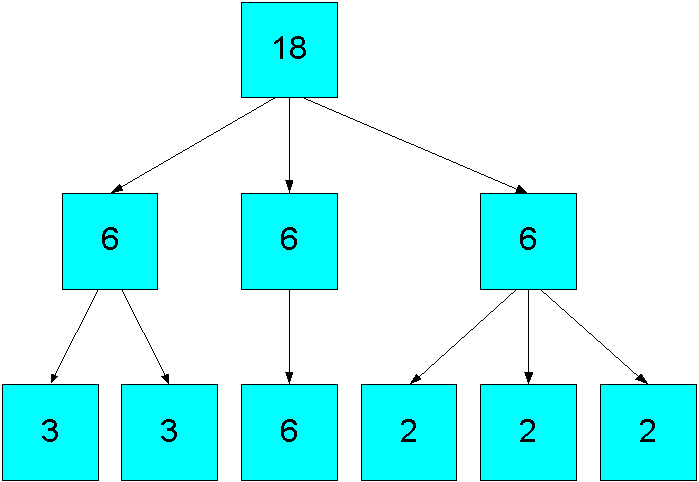
The previous examples show direct allocation, that is, where there is a parent-child relation between the source cell and the target cells. However, most hierarchies have multiple levels, and an allocation may assign values down the hierarchy, as shown in Figure 8-4.
Figure 8-4 Even Allocation in a Multilevel Hierarchy
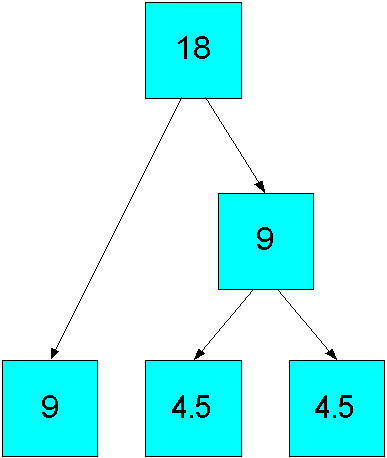
Next, consider a skip level hierarchy. The source value is allocated down the hierarchy, as shown in Figure 8-5. The relationship of the target cell to the allocation source, not the hierarchical level of a cell, determines the allocation. Note that, as the result of an intermediate value in one branch, the base-level cells are allocated different values than in the simple hierarchy shown in Figure 8-2.
Figure 8-5 Even Allocation in a Skip Level Hierarchy
Source, basis, and target are the most fundamental terms for describing allocation. You may use the same measure for all three roles or assign a different measure to each role. All allocation operators require a source and a target, but some operators do not use a basis. You can also multiply the results of an allocation by a weight measure.
The source measure contains the set of numbers that you want to allocate. You may use an existing measure, or you may perform some computation on existing data to construct new source values. For instance, you might want to budget 30 percent growth over the next year and perform an allocation to see the sales targets required for each product to meet that budget. You would create a calculated measure based on actual sales to use as the allocation source. Alternatively, you might generate a forecast at the middle or top of a hierarchy and then allocate the forecast results down to the lower levels.
Depending on the type of allocation, the basis measure may identify which cells will be the targets of an allocation, and what proportion of the allocation each target cell will receive. Different operators use the basis measure in different ways, as illustrated by the diagrams of Even and Proportional operators in "What Is an Allocation?". Note that a basis measure is not used by the hierarchical operators. Refer to "Allocation Operators" for descriptions of all the operators and their use of a basis measure.
The basis measure can be the same as the target measure, or it can be a different measure. For example, suppose you want to calculate the sales of each individual product for an increase in total sales of 15 percent. You would create a calculated measure from Sales that contains the desired aggregate values, and use it as the allocation source. By using the original Sales measure as both the target and the allocation basis, and allocating with the Proportional distribution method, you can generate the individual product sales figures that are needed to produce the desired total sales figure.
If, however, you want to write the results of the allocation to a completely new measure, you would still use the Sales measure as the basis. The new target enables you to preview the allocated results before overwriting the original data. Similarly, you may want to allocate data into a Budget target measure and use an Actuals measure as the basis of the allocation.
The target measure stores the results of an allocation. By default, the target and the basis are the same measure. However, you may prefer to use a different target measure so that you can preview the results of an allocation before overwriting any original values.
You can perform a calculation on the allocated values before they are stored in the target measure. For example, you might need to convert Sales numbers to a different currency. You might create a budget in US dollars, and then translate the allocation target into local currencies. To accomplish this, you would multiply the target values by a weight measure that contains the currency translation rates.
You can perform an allocation over an entire measure or over selected branches of the hierarchy. You must restrict the allocation to a portion of the measure under these circumstances:
You want to allocate some of the values at the top of the hierarchy, but not all the values.
For example, you may need to restrict the Time dimension to a few future periods to prevent allocating over all the historical data.
You want to allocate some values that are in the middle of the hierarchy.
For example, you may have generated a forecast at the Month level of Time and the Brand level of Product, and you want to allocate those numbers down to the base.
You want to allocate down to the middle of the hierarchy, not to the base.
For example, you do not want to proliferate data to the Day level of Time and the SKU level of Product, because you are setting sales quotas, which do not need that level of detail.
The dimension members that you select for the allocation is used to identify the source and the target cells. The selection must include:
In the source measure, the cells at the top of the hierarchy that contain the values to be allocated.
In the target measure, the cells down the hierarchy that will be allocated values.
Figure 8-6 shows a portion of a Time hierarchy with the source allocation values at the Quarter level. How the allocation is performed depends on which members are selected (or in status). Table 8-1 describes various status settings and their effect on the allocation.
Figure 8-6 Allocating at the Quarter Level
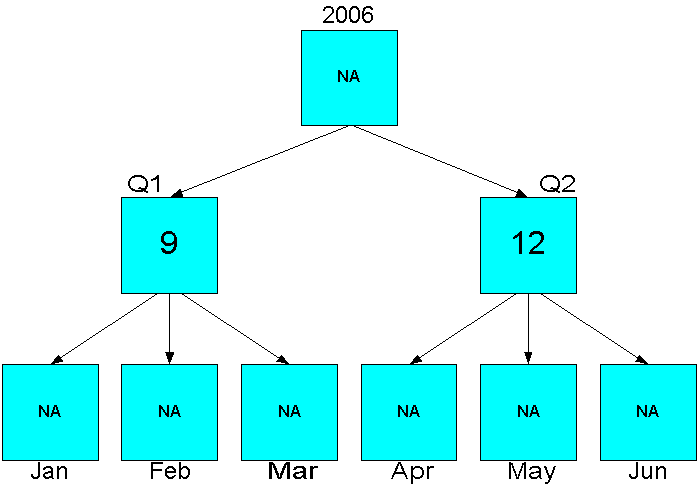
Table 8-1 Results of Status on Allocation at the Quarter Level
| Status | Allocation | Explanation |
|---|---|---|
|
All |
None |
The top member of the hierarchy (2006) has no value, so there is no source value to allocate. |
|
All quarters |
None |
The children of Q1 and Q2 are not in status, so there is no target for allocation. |
|
All quarters, all months |
Jan to Jun |
Q1 and Q2 are in status, so the value 9 is allocated to Jan, Feb, and Mar, and the value 12 is allocated to Apr, May, and Jun. |
|
Q1, Jan to Mar |
Jan to Mar |
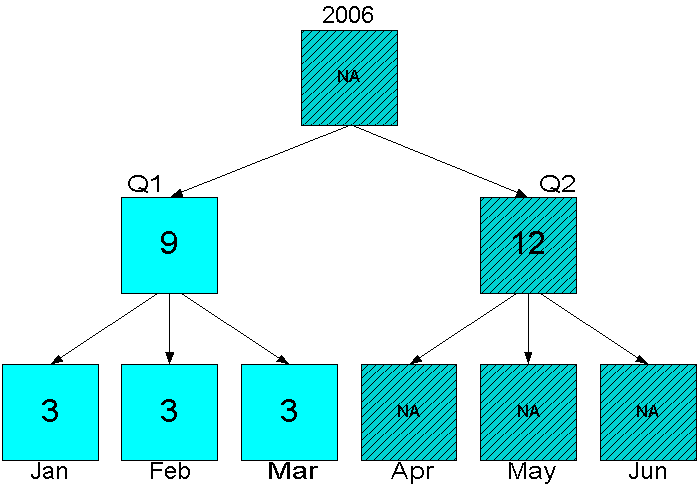
Q1 and its children are in status, so the value 9 is allocated to Jan, Feb, and Mar. Q2 is not in status and is not allocated. |
Figure 8-7 shows the correct status for allocating only Q1.
Figure 8-7 Status for Allocating One Mid-Level Branch of a Hierarchy
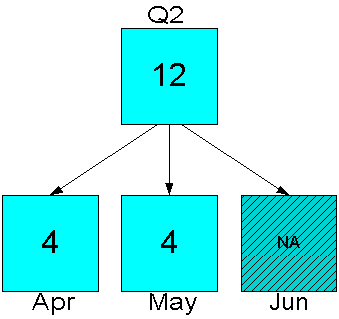
When calculating the allocation, the OLAP engine will, if necessary, expand the current status to include siblings. Figure 8-8 shows an even allocation when Q2, Apr and May are in status. Jun is not a target and does not get a value. Nonetheless, the engine divides the allocated value of 12 by all three children, not just the two targets, to calculate the values for Apr and May.
Figure 8-8 Even Allocation to Selected Child Members
When the allocation path from the source to the target cells is not defined by the current status, the engine may populate the siblings of cells along the path. This information is important only if you want to avoid overwriting existing values or unnecessarily proliferating data.
Figure 8-9 shows the results of an allocation from 2006 to the three months in Q2. Only 2006, Apr, May, and Jun are in status. This status does not define a path from the source to the target. Because the Quarter level is on the path to the target, all of the quarters are allocated a value.
Figure 8-9 Even Allocation Without a Defined Allocation Path
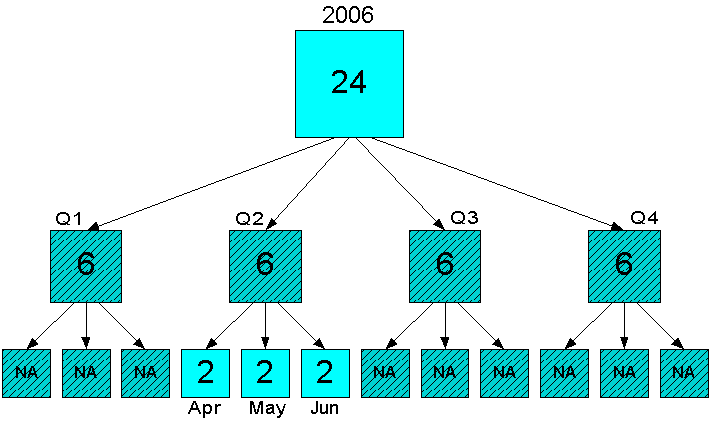
However, when Q2 is included in status, it is the only quarter to get an allocated value, as shown in Figure 8-10.
Figure 8-10 Even Allocation With a Defined Allocation Path
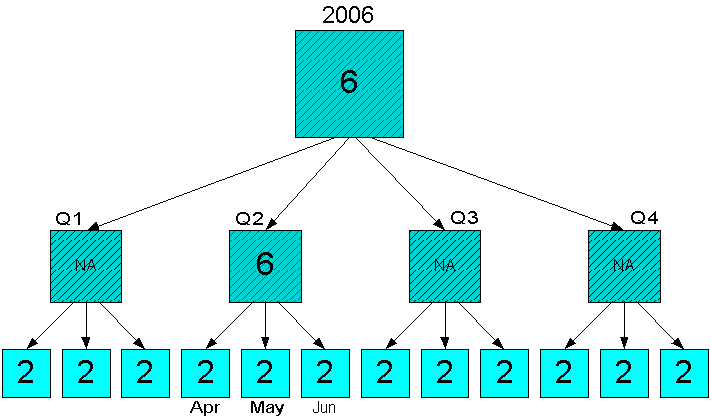
You can create allocations in Analytic Workspace Manager by defining an allocation step in a Calculation Plan. Take these steps:
Create the source, basis, target, and weight measures. They must be in the same cube. The source, basis, and weight measures can be either stored measures or calculated measures. The target measure must be a stored measure.
Create an allocation step:
In the navigation tree, create a new Calculation Plan or open an existing plan.
On the General tab of the Calculation Plan property page, click New Step, then choose New Allocation Step.
The New Allocation Step property pages are displayed.
Complete the General page, being careful to select the correct source, target, and basis measures.
On the Rules page, use the up- and down-arrows to list the dimensions in the order you want them calculated. If you assign different operators to different dimensions, then the allocated values may be different depending on the order.
Select an operator for each dimension that you want to allocate, and a weight measure if desired.
On the Status page, select the members for each dimension of the measure. To allocate values from the top down to the base, retain the default selection of All Levels. Otherwise, select the dimension members with the source data and the target members.
Refer to "Selecting Dimension Members for an Allocation" for information on selecting the dimension values.
Click Create to save the allocation step, then Apply to save the Calculation Plan.
To allocate the data, right-click the Calculation Plan in the navigation tree, then choose Execute Calculation Plan.
To view the results of the allocation, right-click the target measure and choose View Data.
Allocation operators determine the methodology for distributing source values to their targets. There are three basic types of allocation operators: Copy, Even Distribution, and Proportional Distribution.
Within these basic types are regular operators and hierarchical operators. The regular operators only assign values to cells identified by the basis measure as having a value. The hierarchical operators do not use a basis measure. They assign values to all target cells.
Note:
The hierarchical operators may increase the size of a measure dramatically by allocating values to previously empty cells. Be careful to set the status of all dimensions.Copy: Copies the allocation source to all of the target cells that have a basis value that is not NA (null).
Hierarchical Copy: Copies the allocation source to all of the target cells specified by the hierarchy, regardless of the basis value.
Minimum: Copies the allocation source to the target that has the smallest basis value.
Maximum: Copies the allocation source to the target that has the largest basis value.
First non-NA Data Value: Copies the allocation source to the first target cell that has a non-NA basis value.
Hierarchical First Member: Copies the allocation source to the first target cell specified by the hierarchy, regardless of the basis value.
Last non-NA Data Value: Copies the allocation source to the last target cell that has a non-NA basis value.
Hierarchical Last Member: Copies the allocation source to the last target cell specified by the hierarchy, regardless of the basis value.
These are the even distribution operators:
Even: Divides the allocation source by the number of target cells that have non-NA basis values and applies the quotient to each target cell.
Hierarchical Even: Divides the allocation source by the number of target cells, including the ones that have NA values, and applies the quotient to each target cell.
The proportional distribution operator is:
Proportional: Divides the allocation source by the sum of the basis values, then multiplies the quotient by the individual basis value for each target cell.
The allocation system operates as the logical inverse of the aggregation system. In other words, if you allocate down from a middle level of a hierarchy, you can aggregate up to the top of the hierarchy using an aggregation operator that corresponds to the allocation operator. Table 8-2 shows the correspondence between allocation operators and aggregation operators.
Table 8-2 Corresponding Allocation and Aggregation Operators
| Allocation Operator | Aggregation Operator |
|---|---|
|
Copy |
Average |
|
Hierarchical Copy |
Average |
|
Minimum |
Minimum |
|
Maximum |
Maximum |
|
First non-NA Data Value |
First Non-NA Data Value |
|
Last non-NA Data Value |
Last Non-NA Data Value |
|
Hierarchical First Member |
Hierarchical First Member |
|
Hierarchical Last Member |
Hierarchical Last Member |
|
Even |
Sum or Average |
|
Hierarchical Even |
Hierarchical Average |
|
Proportional |
Sum |
This example creates a sales budget that is 10% higher than the previous year's sales. It uses a calculated measure to generate the increase, then distributes the total increase evenly down the dimension hierarchies.
To create the source measure:
Expand the UNITS_CUBE folder, right-click Calculated Measures, and choose Create Calculated Measure.
The Calculation Wizard opens.
Complete the Name and Type page with these values:
Name: sales_py
Calculation Type: Prior Value (under Prior/Future Comparison)
Complete the Prior Value page with these values:
Measure: Sales
Over Time in: Calendar Year
Go back by: 1 Year
Create a second calculated measure with the name SALES_BUDGET.
For the calculation, expand the Basic Arithmetic folder and choose Multiplication.
On the Multiplication page, multiply SALES_PY by 1.1.
This example stores the allocated data in a separate measure from the source data to assure that the allocated data does not overwrite any source data.
To create the target measure:
In the UNITS_CUBE folder, right-click Measures and select Create Measure.
The Create Measure dialog box opens.
On the General page, create a measure named ALLOC_SALES_BUDGET.
Select Override the Aggregation Specification of the Cube.
On the Summarize To page, deselect all levels for all dimensions.
The measure is not mapped to a data source, so no aggregation needs to be done during regular builds. Instead, aggregation will be defined in the Calculation Plan. The aggregation step is not shown in this example; refer to "Case Study: Forecasting Sales for Global Enterprises" for an example that shows forecasting, allocation, and aggregation.
Budget Plan will have an allocation step and an aggregation step (not shown).
To create a new Calculation Plan:
Right-click Calculation Plans and select Create Calculation Plan.
The Create Calculation Plan dialog box opens.
Create a new plan named BUDGET_PLAN. Click Create.
BUDGET_PLAN appears as a new item in the Calculation Plans folder. It does not yet contain any steps.
The SALES_BUDGET calculated measures generates data at all levels. The allocation will redistribute the data from the top of the hierarchy to the lowest levels and store it in the target measure.
To create an allocation step:
On the General page of Sales Plan, click New Step, then select New Allocation Step.
The Create Allocation Step dialog box opens.
Complete the General page with these values:
Name: allocate_budget_step
Cube: UNITS_CUBE
Source Measure: SALES_BUDGET
Target Measure: ALLOC_SALES_BUDGET
Basis Measure: SALES_BUDGET
On the Rules page, assign Hierarchical Even for the Time operator. For the other dimensions, assign the Proportional operator.
On the Status page, keep the default status of All Levels for all dimensions.
Click Create to save the allocation step.
Click Apply to save the Calculation Plan.
To generate the allocation:
Expand the Calculation Plans folder. Right-click BUDGET_PLAN and choose Execute Calculation Plan BUDGET_PLAN.
The Maintenance Wizard opens, and BUDGET_PLAN is a selected target object.
Click Finish.
The build log is displayed when the Calculation Plan is done executing.
To view the forecast results, take these steps:
Fully expand the UNITS_CUBE folder, right-click the ALLOC_SALES_BUDGET measure, and choose View Data ALLOC_SALES_BUDGET.
The Measure Data Viewer opens. No data is displayed, because the top dimension levels provide the source data, not the allocated data.
From the File menu, choose Query Builder.
The Query Builder opens.
On the Layout tab, switch Product and Customer. Click Help for instructions.
On the Dimensions tab, set the status of all dimensions to the base level. You may wish to select just a few values from these lists. For Time, limit the months to 2004, since that it is only allocated year.
Click OK to close the Query Builder.
Figure 8-11 shows a sample of the allocated data. The allocated data should be aggregated from these base levels to the top by an aggregation step.