| Oracle® Data Guard Broker 10g Release 2 (10.2) Part Number B14230-02 |
|
|
View PDF |
| Oracle® Data Guard Broker 10g Release 2 (10.2) Part Number B14230-02 |
|
|
View PDF |
This chapter provides several scenarios that show how to use the Oracle Enterprise Manager graphical user interface (GUI)Foot 1 to create, manage, and monitor a Data Guard configuration.
This chapter contains the following scenarios:
Access the Data Guard Web pages through the Oracle Enterprise Manager Grid Control using the following steps:
Note:
Oracle Enterprise Manager Grid Control provides access to the complete set of Data Guard features. Limited monitoring-only Data Guard functionality is available in Enterprise Manager Database Control.Click the Targets tab to go to the Targets page.
Click Databases to go to the Databases page.
On the Databases page, you see a listing of all discovered databases. In this scenario, the primary database, North_Sales, has already been discovered. Click the North_Sales database to go to the primary database home page.
Click Maintenance.
In the High Availability section under Data Guard, click Setup and Manage and log in.
Note:
If you log in as a user withSYSDBA privileges, you will have access to all Data Guard functionality, including all monitoring and management features. If you log in as a non-SYSDBA user, you will have access to monitoring functions only; features such as standby creation, switchover, and failover will not be available.If the primary database is not already in a broker configuration, clicking Setup and Manage in Step 5 will go to the page shown in Figure 6-1. This screenshot shows information presented on the All Targets tab, containing graphs for all targets discovered for the cluster. From the list of managed targets, you can quickly assess the availability of the targets and click any graph to drill down for more information.
See Also:
Section 6.2, "Scenario 2: Creating a Configuration or Adding an Additional Standby Database"If the primary database is already part of a broker configuration, clicking Setup and Manage in Step 5 will go to the Data Guard Overview page as shown in Figure 6-2.
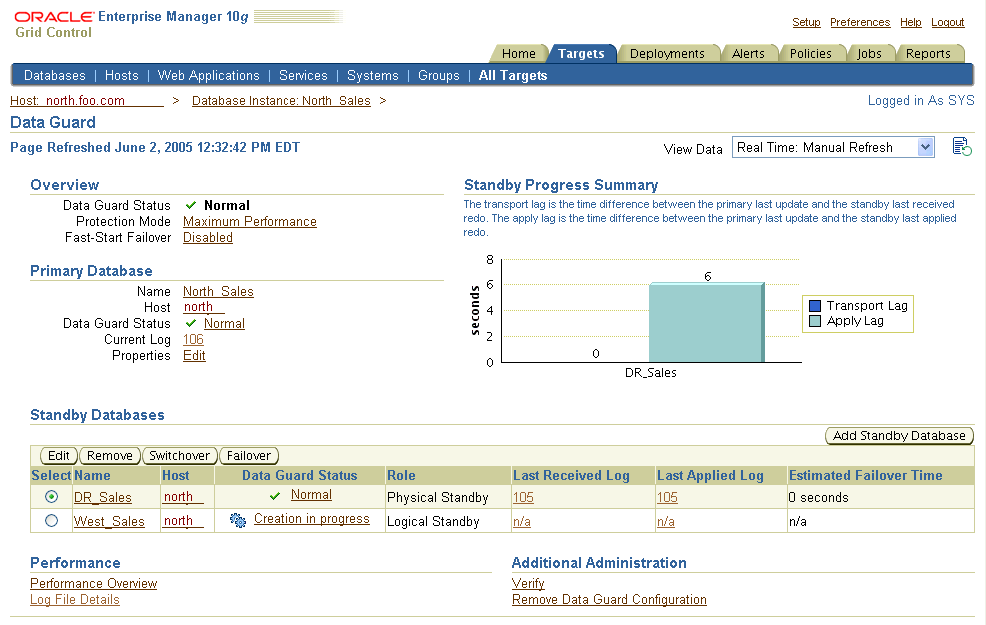
On the Data Guard Overview page, you can:
Edit the protection mode—click Protection Mode in the Data Guard Overview section to view the current protection mode setting and, if necessary, change the protection mode.
Enable Fast-Start Failover—click Disabled to invoke the Fast-Start Failover wizard that will guide you through the process of enabling fast-start failover and the observer.
View a summary of standby progress—this chart shows the amount of data that each standby database has not yet received and applied.
Retrieve information about the primary database—click Name, Host, Status, Current Log, or Properties (Edit) to view pertinent information about the primary database.
If you click Status or Edit, you are taken to the Edit Properties page where you can view and change the current state or properties of the primary database.
View or change information on the standby databases:
Add a standby database to the broker configuration—click Add Standby Database to add a physical or logical standby database.
Change the state or properties—click Edit to go to the Edit Properties page to view and change the current state or properties of the standby database.
Discontinue Data Guard broker control—click Remove to remove the selected standby database from Data Guard broker control.
Switch the role from standby to primary—click Switchover to switch the database roles from standby to primary.
Transition the standby database to the role of primary database— click Failover when a catastrophic failure occurs on the primary database, and there is no possibility of recovering the primary database in a timely manner. The target standby database assumes the primary role, and the failed primary database is disabled by the broker. See Section 5.4.3 for steps to reenable the failed primary database as a standby database to the new primary database.
View performance information for the configuration and status of online redo log files for each standby database:
Click Performance Overview to view information about data archived and applied, a summary of standby progress, and a summary of log services.
Click Log File Details to view the status of online redo log files that were generated on the primary database but not received by the standby, and for online redo log files that were received but not applied to the standby database
Perform additional administrative activities:
Click Verify to check the protection mode and properties, confirm that standby redo log files are present, and verify log switch.
Click Remove Data Guard Configuration to remove the broker configuration from Data Guard broker control.
Search for information about any Enterprise Manager topic—Click Help to display the Welcome to Oracle Data Guard help topic. Once in the online Help system, you can use the Contents page or Search page to locate help topics of interest.
Creating a broker configuration is the first thing you must do before you can manage and monitor the databases. Enterprise Manager provides the Add Standby Database wizard to create a broker configuration that includes a primary database and one or more standby databases. This scenarios shows how to use the Add Standby Database wizard later to add a logical standby database to a broker configuration that already has one physical standby database (DR_Sales). To start the Add Standby Database wizard, click Add Standby Database on the Data Guard Overview page.
After clicking Add Standby Database, you can select one of the following options:
Create a new physical standby database (single-instance only)
Create a new logical standby database (single-instance only)
Manage an existing standby database with Data Guard broker..
Create a primary database backup only
You will need to connect to the primary database using SYSDBA credentials, if you are not yet connected.
See Also:
Oracle Data Guard Concepts and Administration for the steps about how to create a RAC standby databaseFigure 6-3 show the introductory page of the create configuration process.
Figure 6-3 Add Standby Database Wizard - Introductory Page
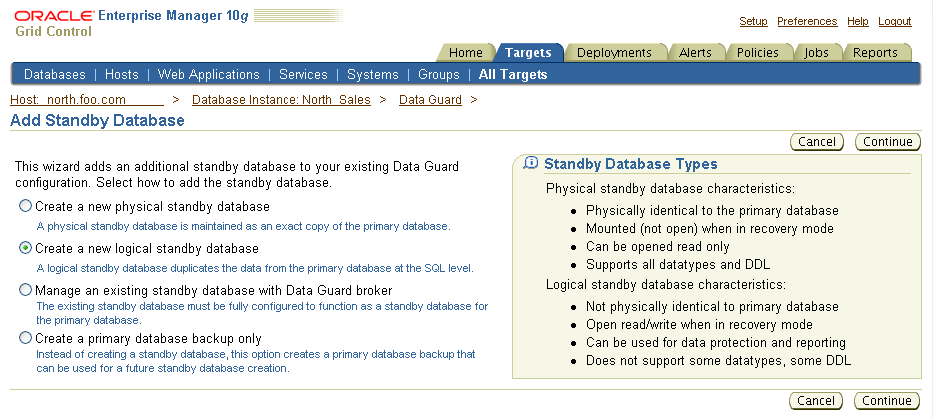
The Add Standby Database wizard takes you through the following steps:
The following steps assume a broker configuration already exist with one primary database and one physical standby database, and creates a new logical standby database. It shows how the wizard takes you through additional steps to select the Oracle home for the database and to copy datafiles to the standby database.
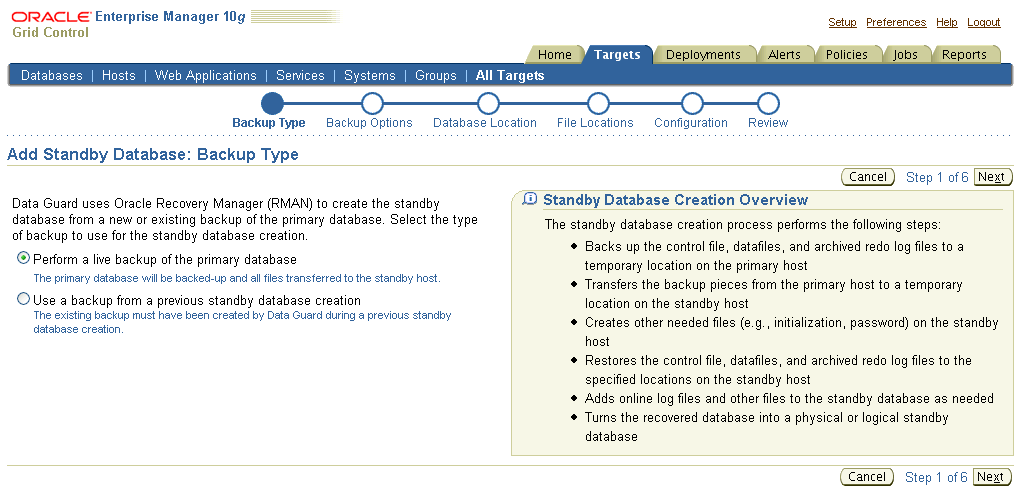
Step 1 Determine the backup type.
Enterprise Manager uses Oracle Recovery Manager (RMAN) to create a single-instance standby database from a new or existing backup of the primary database. You can select one of two backup operations to use for the standby database creation:
Perform a live backup of the primary database
Use an existing backup of the primary database
Figure 6-4 shows Step 1 of 6 of the configuration process if you are adding a logical standby database.
Figure 6-4 Add Standby Database Wizard - Backup Type (Logical Standby Database)
You can click Cancel to terminate the current process and begin again at the introductory page of the Add Standby Database wizard.
Figure 6-5 shows additional screen content that appears when you are adding a logical standby database.
Figure 6-5 Add Standby Database Wizard - Backup Type (Logical Standby Database)

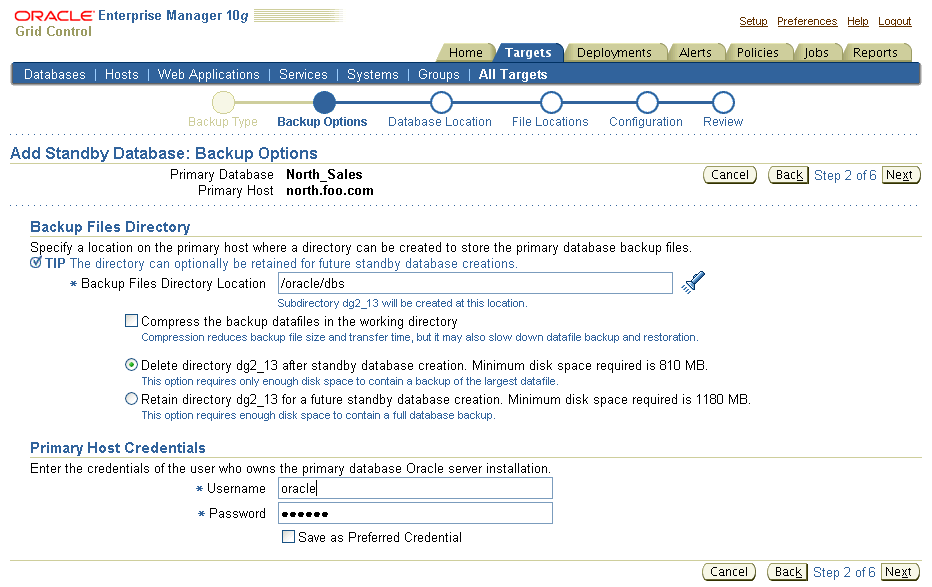
Step 2 Set up the backup options.
A working directory is needed to store the primary database backup files. It can optionally be retained and used to create additional standby databases in the future. Specify a location on the primary host in which the working directory can be created.
Primary host credentials are required for this step. Enter the credentials of the owner of the primary database Oracle server installation. These credentials can be saved by checking the box marked Save as Preferred Credential.
You can click Cancel to terminate the current process and begin again at the introductory page of the Add Standby Database wizard.
Figure 6-6 shows Step 2 of 6 of the configuration process.
Figure 6-6 Add Standby Database Wizard - Backup Options
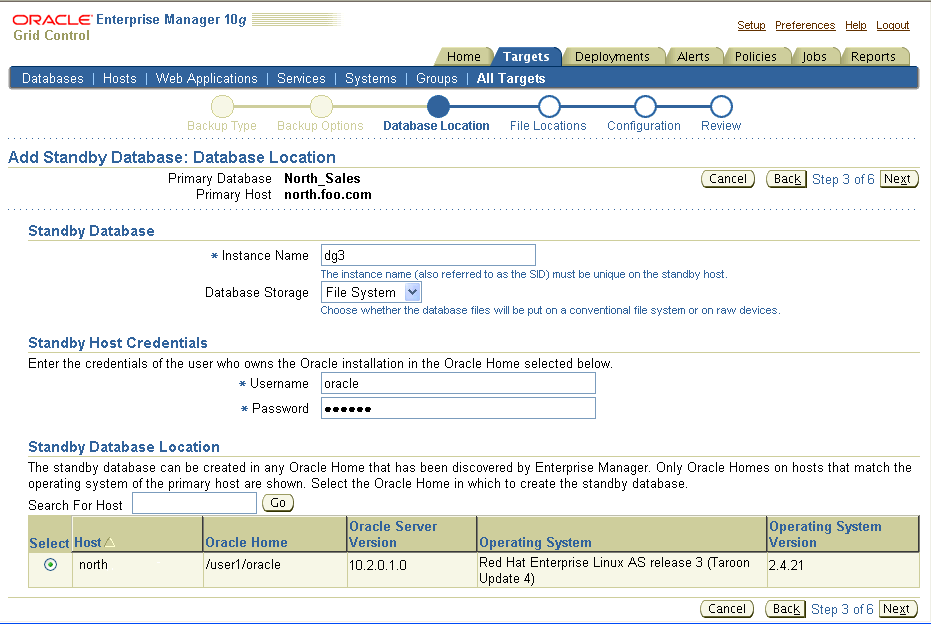
Step 3 Select the Oracle home in which to create the standby database.
The standby database can be created in any Oracle home that was discovered by Oracle Enterprise Manager. Only Oracle homes on hosts that match the operating system of the primary host are shown. You must select a discovered Oracle home and provide a unique instance name for the standby database. Standby host credentials are required to continue.
Figure 6-7 shows Step 3 of 6 of the configuration process.
Figure 6-7 Add Standby Database Wizard - Database Location
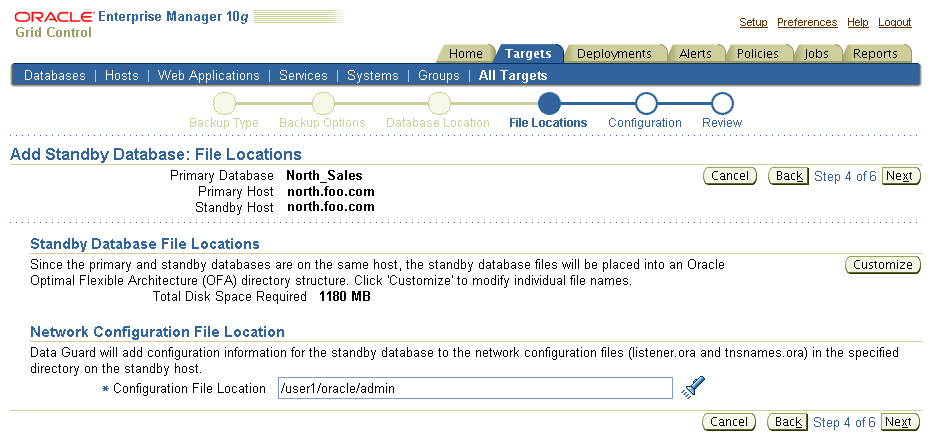
Step 4 Set up the location for standby database files.
Part of the create broker configuration process involves making the datafiles for the primary database available to the standby host. You have the option of customizing the location for the standby database files. Standby host credentials are required to continue. The following list describes your options:
Specify the backup file access method
Choose the method by which you want to make the primary database backup files accessible to the standby host. The two options are:
Transfer files from the primary host working directory to a standby host working directory
Directly access the primary host working directory location from the standby host using a network path name
Specify the standby database file location
Choose the locations for the standby database files. You have two options:
Convert to Oracle OFA (Optimal Flexible Architecture)
Keep file names and locations the same as the primary database
Specify the network configuration file location
Data Guard will add configuration information for the standby database to the network configuration files (listener.ora and tnsnames.ora) in the specified directory on the standby host.
You can click Cancel to terminate the current process and begin again at the introductory page of the Add Standby Database wizard.
Figure 6-8 shows Step 4 of the configuration process.
Figure 6-8 Add Standby Database Wizard - File Locations
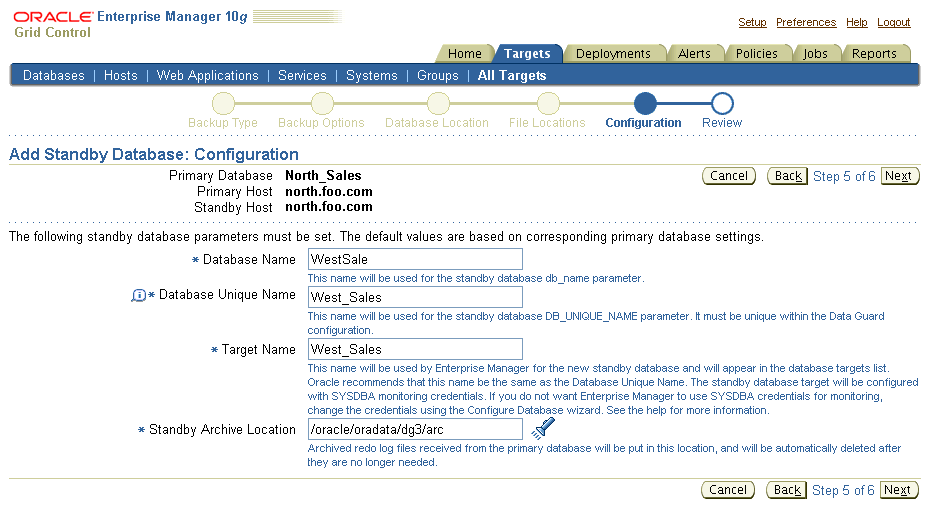
Step 5 Provide standby database configuration parameters.
Standby database configuration parameters must be set. These parameters include the database name, database unique name, target name, and standby archive location. The standby archive location can be a regular directory or a flash recovery area. The default values are based on corresponding primary database settings.
You can click Cancel to terminate the current process and begin again at the introductory page of the Add Standby Database wizard.
Figure 6-9 shows Step 5 of 6 of the configuration process.
Figure 6-9 Add Standby Database Wizard - Configuration
Step 6 Review the information before clicking Finish.
The Add Standby Database wizard allows one last review of the data you input for the configuration and standby database. Click Finish when you are certain all of the information is correct.
You can click Cancel to terminate the current process and begin again at the introductory page of the Add Standby Database wizard.
Figure 6-10 shows Step 6 of 6 of the configuration process.
Figure 6-10 Add Standby Database Wizard - Review
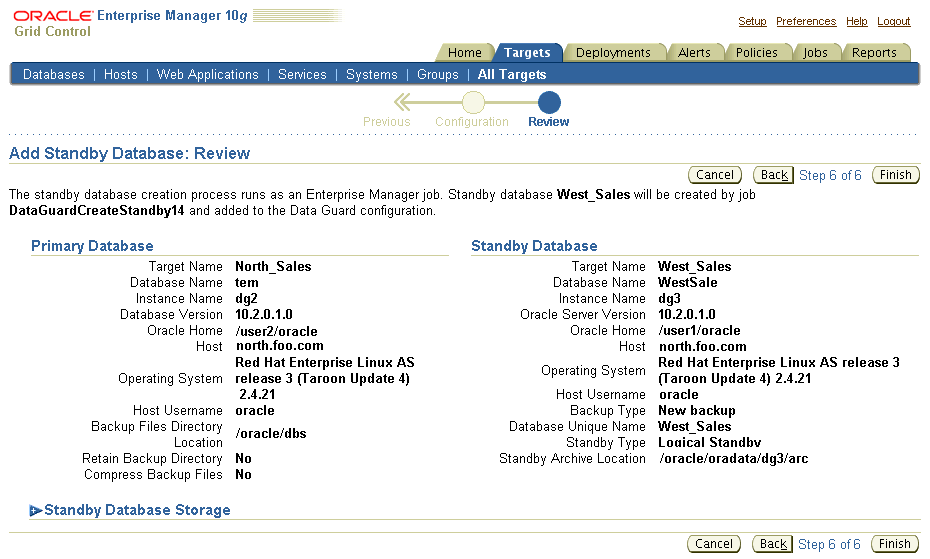
By clicking Standby Database Storage, you can see additional information about all the standby database file locations.
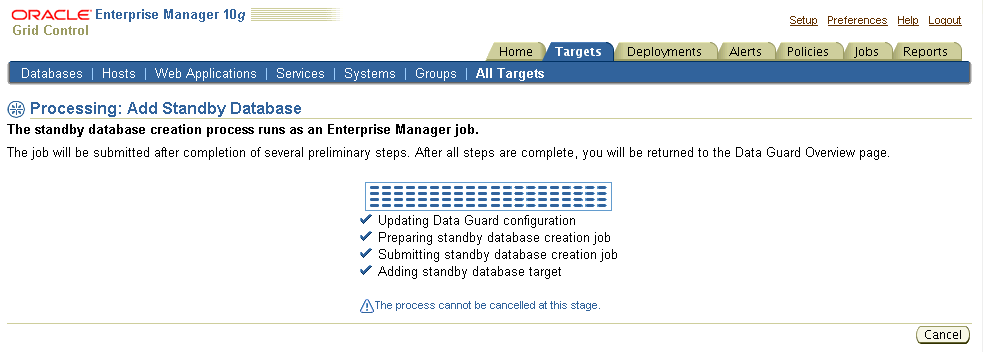
Once you click Finish, the standby database creation process runs as an Oracle Enterprise Manager job. You can cancel the standby creation at any point before the job submission. Figure 6-11 shows the standby database creation process.
Figure 6-11 Add Standby Database Wizard - Processing
After the job is submitted, you will be returned to the Data Guard Overview page. In the Status column of the Standby Databases table, you will see Creation in progress listed. If you click that link, you can monitor the progress of the standby database creation. Figure 6-12 shows the Data Guard Overview page with this link.
To add additional standby databases after the initial creation of the configuration, click Add Standby Database to run the Add Standby Database wizard again.
Figure 6-12 Data Guard Overview Page - Creation in Progress
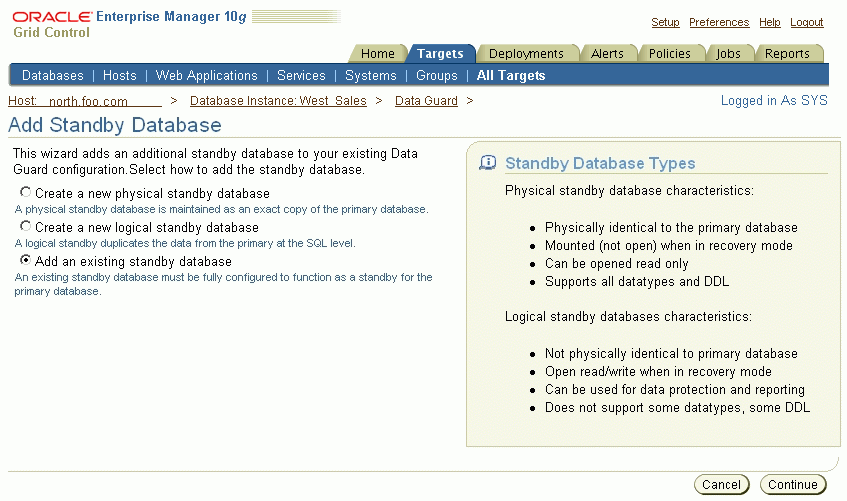
Although the Add Standby Database wizard will not create a RAC standby database, you can add an existing RAC standby database into a Data Guard configuration. Click Add Standby Database to run the Add Standby Database wizard and select Add an existing standby database.
Figure 6-13 shows the Add Standby Database introductory page.
Figure 6-13 Adding an Existing RAC Standby Database to the Data Guard Configuration
The Add Standby Database wizard takes you through the following steps:
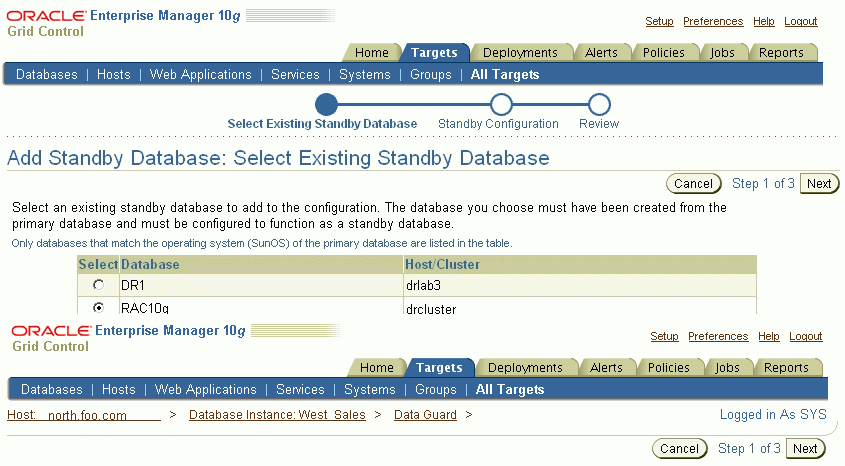
Step 1 Select an existing standby database.
In this step, select the RAC standby database you want to add to the configuration. All discovered databases in your environment (both RAC and non-RAC databases) will be shown in the list. In the example shown in Figure 6-14 (Step 1 of 3), one of the databases in the list (RAC10g) is a RAC standby database.
You can click Cancel at any time to terminate the current process and begin again at the introductory page of the Add Standby Database wizard.
If you wish to continue, click Next.
Figure 6-14 Select an Existing Standby Database
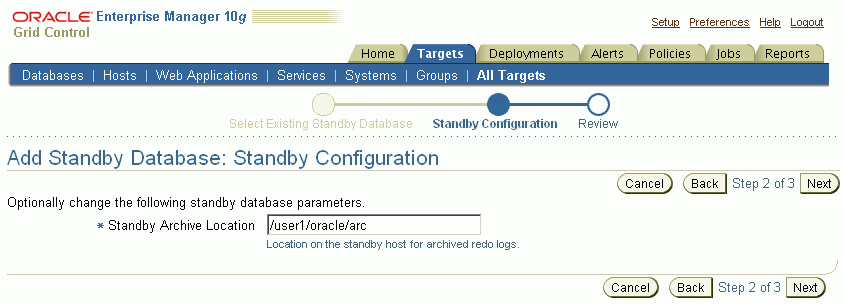
Step 2 Set the standby archive location setting.
You can optionally change the Standby Archive Location setting of the existing standby cluster database, as shown in Figure 6-15 (Step 2 of 3).
If you wish to continue, click Next.
Figure 6-15 Add Standby Database: Standby Configuration
Step 3 Review the configuration settings.
Review the data for the configuration and standby database, as shown in Figure 6-16 (Step 3 of 3).
You can click Cancel to terminate the current process and begin again at the introductory page of the Add Standby Database wizard.
If you wish to complete the operation, click Finish.
You can enable fast-start failover from any site, including the observer site, while connected to any database in the broker configuration. Enabling fast-start failover does not trigger a failover. Instead, it allows the observer to begin observing the primary and standby databases and initiate a fast-start failover should conditions warrant a failover.
This section describes the steps to enable fast-start failover and the observer:
Step 1 Invoke the Fast-Start Failover wizard.
On the Data Guard Overview Page next to the "Fast-Start Failover" status field, click Disabled to invoke the Fast-Start Failover wizard.
Step 2 Configure the target database and fast-start failover properties.
On the Fast-Start Failover Configure Page:
Select the standby database that you choose to be the target of fast-start failover and set fast-start failover properties. The example shown in Figure 6-17 chooses DR_Sales, a physical standby database, to be the target standby database.
See Also:
Section 5.2 for helpful advice on determining which standby database will make the best target for a failoverFigure 6-17 Fast-Start Failover Wizard: Configure
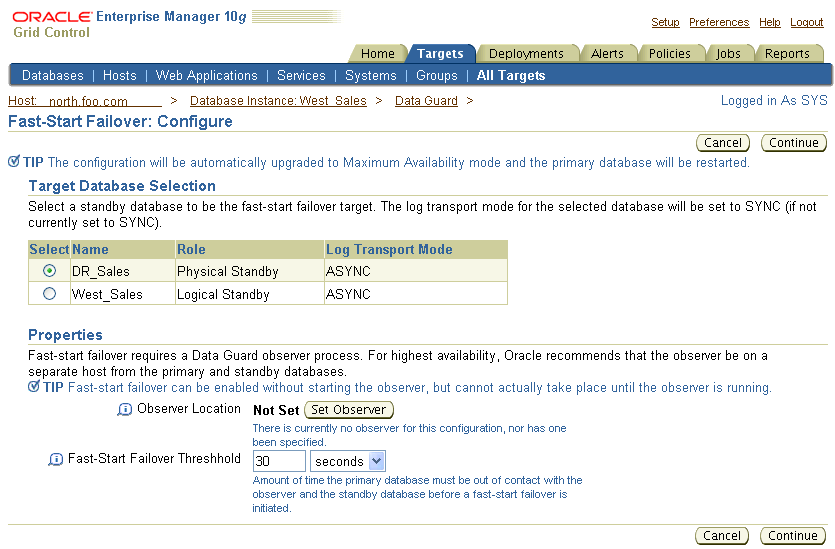
Click Set Observer to specify the system on which the observer will run and the Oracle home:
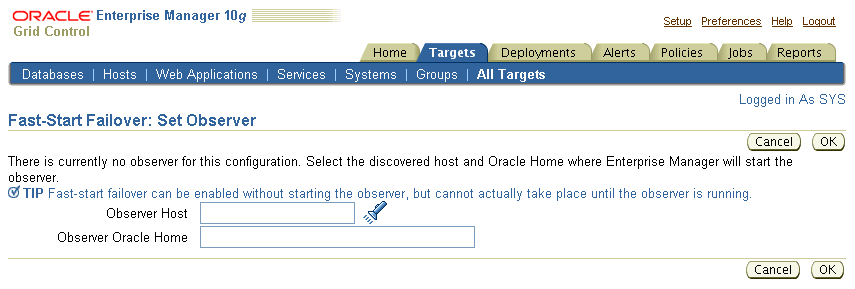
If an observer is not currently defined, the Observer Host and Home fields are blank. You can directly edit the Observer Host and Home fields (in which case the specified host must already be discovered by Enterprise Manager), or you can choose from the list of discovered hosts and their Oracle Homes provided by Enterprise Manager. If you leave the Observer Host and Home fields blank, you may still configure fast-start failover, but you must then manually start an observer for fast-start failover to be ready for fast-start failover.
If an observer host and home is already known to Enterprise Manager, the Observer Host field displays those values when the Set Observer page is displayed. You can change the observer location, in which case the current observer will be stopped and Enterprise Manager will run a remote operation to start the new observer on the specified host.
Figure 6-18 shows the Set Observer page.
Figure 6-18 Fast-Start Failover Wizard: Set Observer
Set the FastStartFailoverThreshold property to specify the number of seconds you want the observer and target standby database to wait (after detecting the primary database is unavailable) before initiating a failover
Click Continue.
Step 3 Enable Flashback Database.
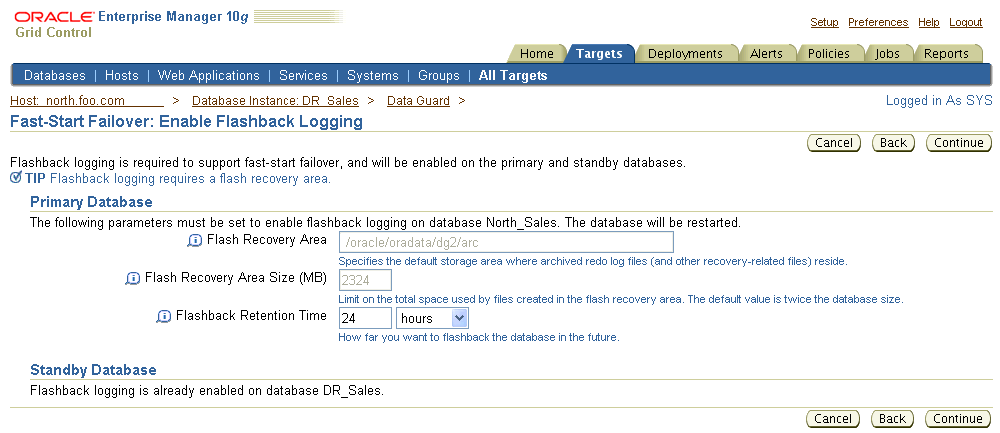
The next page of the Fast-Start Failover wizard enables flashback logging on the primary and standby databases. If either the primary database or the target standby database does not have flashback logging enabled, the page shown in Figure 6-19 will display. On this page you can specify the flash recovery area location, flash recovery area size, and flashback retention time for each database for which flashback logging must be activated.
Figure 6-19 Fast-Start Failover Wizard: Enable Flashback Logging
Step 4 Confirm that you want to enable fast-start failover.
Enterprise Manager displays the Confirmation page shown in Figure 6-20 to verify that you want to start fast-start failover.
Figure 6-20 Fast-Start Failover Wizard: Confirmation

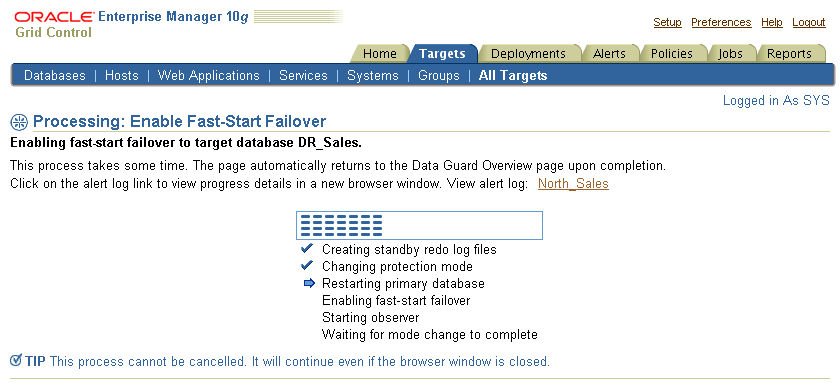
If you click Yes to continue with an enable operation, the Enterprise Manager processing page shown in Figure 6-21 displays. The processing page provides a progress bar and a list of the steps that are being undertaken during the enable operation. The fast-start failover wizard performs the following steps:
Creates standby redo log files on the primary and standby databases
Upgrades the protection mode to Maximum Availability, if required
Restarts the primary and standby databases, if required
Enables fast-start failover
Starts the observer process
Some steps may not be performed. For example, because fast-start failover requires the Data Guard configuration is running in maximum availability mode, this scenario includes the Changing Protection Mode step to upgrade the configuration's protection mode from maximum performance to maximum availability.
Figure 6-21 Fast-Start Failover Wizard: Progress
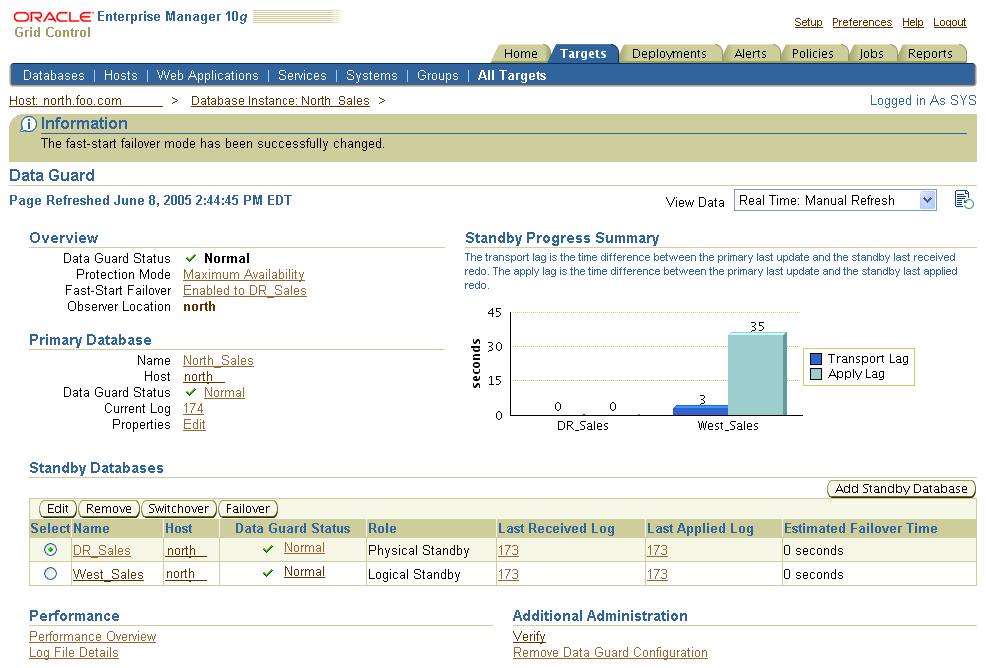
When the operation completes, Enterprise Manager displays the Data Guard Overview page that shows an Enabled status along with the Observer Host.
Figure 6-22 shows how, in this scenario, fast-start failover is "Enabled to DR_Sales." If you were to click this status field, the Fast-Start Failover wizard would be invoked again to lead you through the steps to disable fast-start failover.
Figure 6-22 Fast-Start Failover Is Successfully Enabled
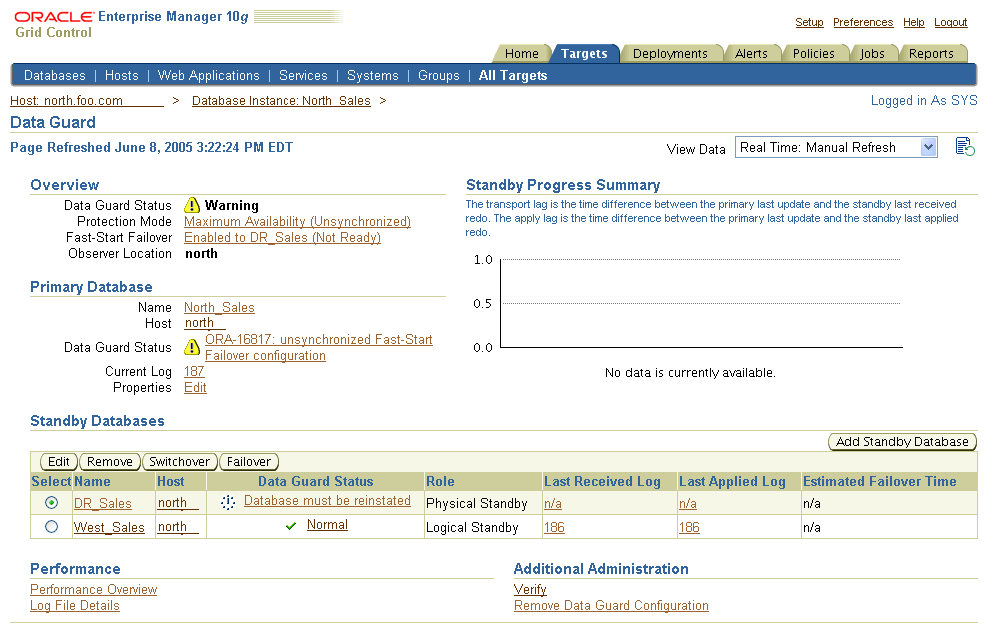
Once fast-start failover and the observer are enabled, the observer continuously monitors the environment to ensure the primary database is available. If the observer detects a problem, the observer attempts to reconnect to the primary database within the time specified by the FastStartFailoverThreshold property. If the problem is not remedied in that time and the target standby database is ready for failover, the observer immediately invokes a fast-start failover. Because a fast-start failover is automatic and fast, you may not be aware it has happened until you notice that reinstatement is needed or is already occurring.
Figure 6-23 shows an example of the warning message that shows when a reinstatement is needed.
Figure 6-23 Reinstating the Former Primary Database After a Fast-Start Failover
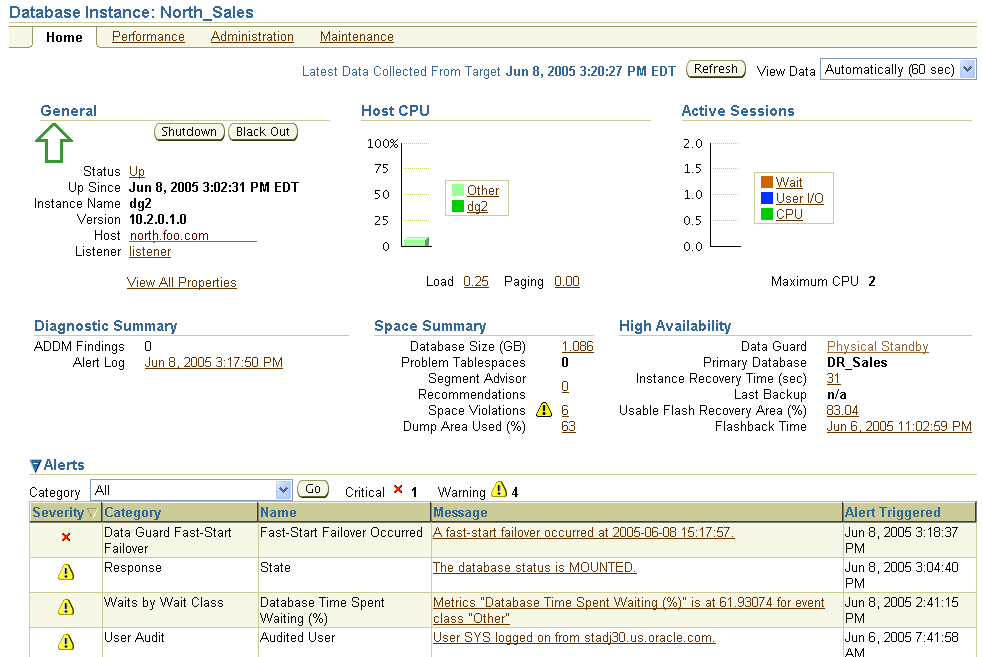
You can also obtain information about your fast-start failover environment by looking at the metrics in the Alert Log Errors page. This page enables you to view a list of log entries containing errors. To see database alerts, navigate to the Database Home page and choose the Alert Log link from the Diagnostic Summary section. The errors are listed in a table that includes a severity level and time stamp for each row. The Category column provides a description of the category type of the error. You can filter the list using View Data to display a day's, week's, or month's worth of data.
Figure 6-24 shows an example of the Alert Log Errors page for the North_Sales database after a fast-start failover occurred.
Figure 6-24 Alert Log Errors Page Showing That Fast-Start Failover Occurred
See Also:
Section 5.5 for complete information about fast-start failovers, the observer, and reinstating the failed primary databaseEnterprise Manager simplifies some of the routine maintenance tasks you must perform in the configuration. The following examples, provided in the following sections, show:
This section describes how to set the standby database to Log Apply Off.
To change the state of the standby database to Log Apply Off, follow these steps:
From the Data Guard Overview page, select the standby database you want to change to the Log Apply Off state.
Click Edit to go to the Edit Properties page.
Select Log Apply Off.
Click Apply.
When the process completes, a message indicating success is returned.
Figure 6-25 shows the Edit Properties page where you can change the state of a database.
Figure 6-25 Changing the State or Properties of a Database
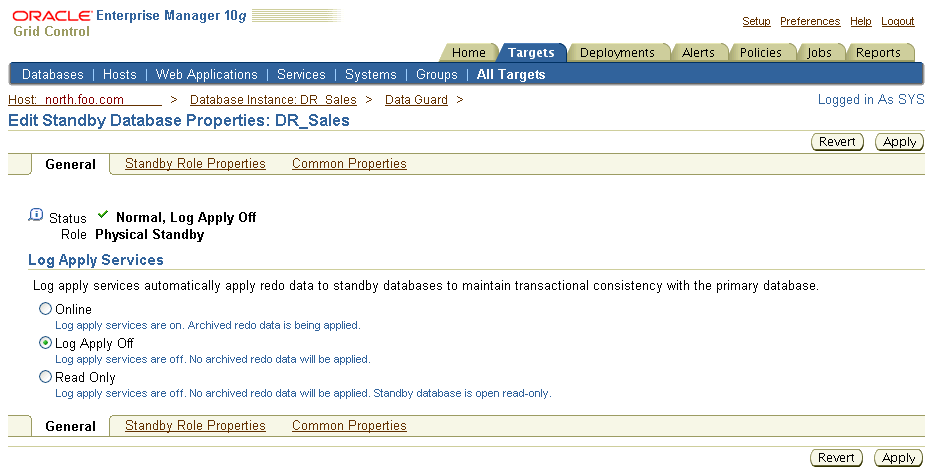
When you change the state of the standby database to Log Apply Off, it stops Redo Apply (or SQL Apply for logical standby databases) from applying the redo data to the standby database. However, redo transport services on the primary database are unaffected; the standby database continues to receive redo data from the primary database.
After completing your maintenance tasks, you can follow the same sequence of steps to bring the database online again.
Enterprise Manager divides the database properties into primary, standby, and common properties.
To view or change properties:
Click either Edit from the Primary Database section or click Edit from the Standby Databases section of the Data Guard Overview page.
Click one of the following:
Standby Role Properties
Common Properties
Make the appropriate change and click Apply.
When the process completes, a message indicating success is returned.
Figure 6-26 shows properties specific to the standby database.
By clicking Show Advanced Properties, you can view additional properties specific to the standby database, as shown in Figure 6-27.
Figure 6-28 shows properties common to both the primary database and the standby database.
You can change the broker configuration's overall protection mode with Enterprise Manager.
When the configuration was first created it was placed in the maximum performance mode by default. This section describes the process for upgrading to the maximum protection mode. The maximum protection mode guarantees that no data loss will occur if the primary database fails.
To set the maximum protection mode:
Click Maximum Performance under the Overview section on the Data Guard Overview page.
Select Maximum Protection and click Continue.
Figure 6-29 shows the Edit Protection Mode page.
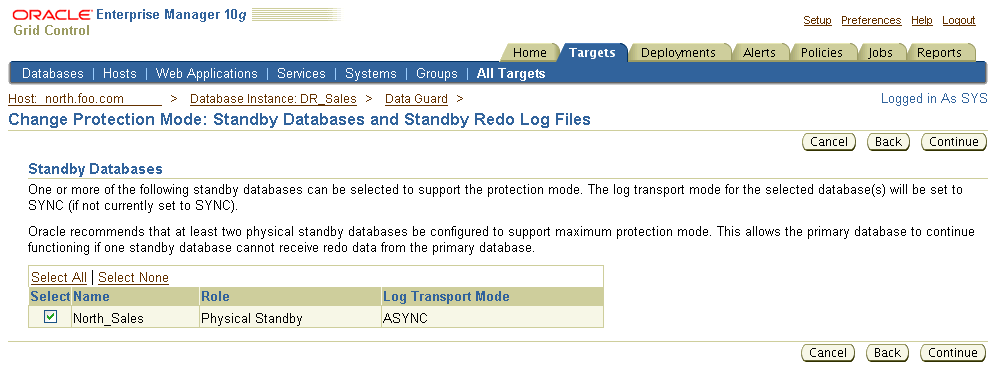
Select one or more of the standby databases listed in Figure 6-30 that you want to support the maximum protection mode. The redo transport service (and LogXptMode property) will automatically be set to SYNC for the primary database and the selected standby databases.
Data Guard broker automatically determines the correct number and size of standby redo log files needed for all databases in the configuration and adds those log files using the directory locations you specify. Click Continue to go on.
Figure 6-30 Change Protection Mode - Standby Databases and Online Redo Log Files
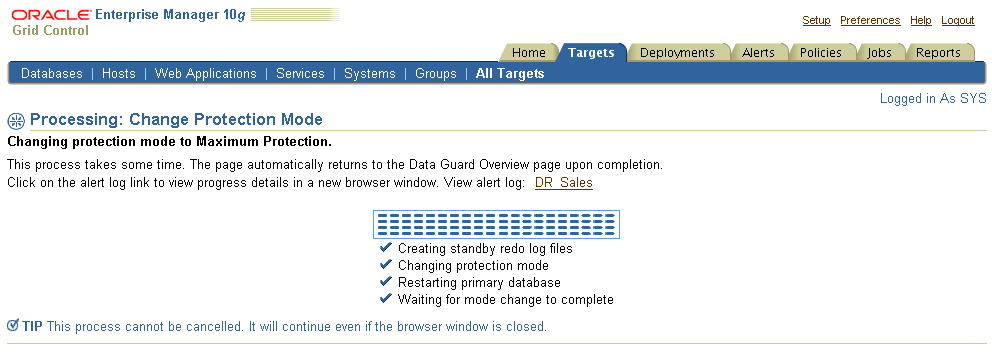
Confirm that you want to change the protection mode. Click Yes to continue or No to cancel. This scenario assumes you are accepting the change by clicking Yes. Then, the Edit Protection Mode Processing page is displayed, as shown in Figure 6-31.
Figure 6-31 Change Protection Mode - Process
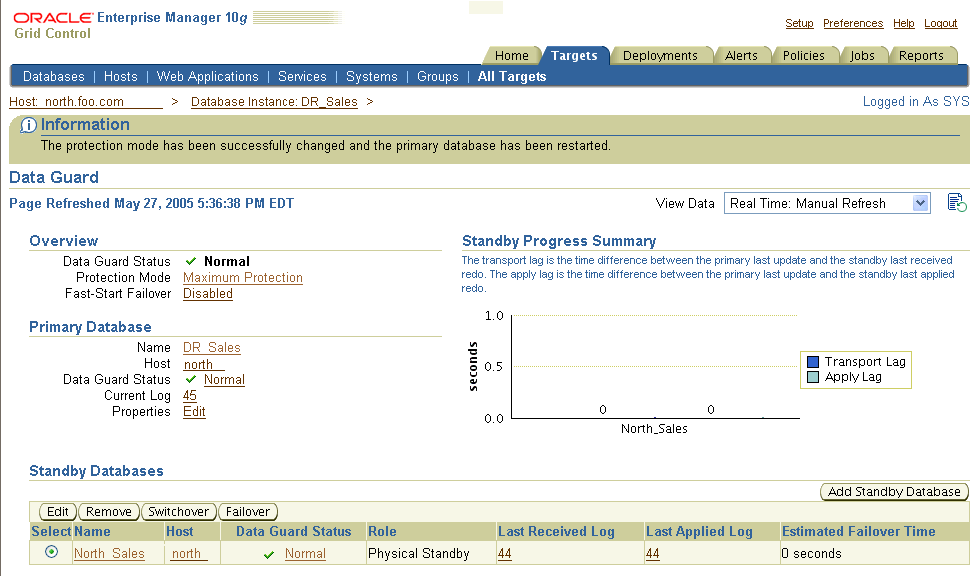
Once the protection mode is successfully updated, the Data Guard Overview page is displayed as shown in Figure 6-32.
Figure 6-32 Protection Mode Successfully Changed
There may be occasions when you might want to perform a switchover between the primary database and standby databases. This scenario steps you through the process of using the switchover operation to switch roles between the primary database and a standby database.
To execute a switchover, perform the following steps:
Select the standby database that you want to become the primary database.
Click Switchover.
Click Yes to continue with the switchover. Click No to cancel.
Figure 6-33 shows the Switchover Confirmation page.
The Switchover operation performs the following steps:
Ensures that the primary database and standby database are not currently in an error status condition and verifies that broker management of the primary database is enabled and online.
If the switchover target is a physical standby database, you can view any active user sessions connected to the primary using the Browse Primary Database Sessions link. These sessions will be closed automatically during the switchover.
Performs the switchover by first changing the primary database to the standby role, and then the standby database to the primary role, displaying a progress indicator as the switchover progresses.
If the switchover target is a physical standby database, both it and the primary database will be restarted.
Figure 6-34 shows the Processing page during the switchover.
Figure 6-34 Processing Page During Switchover
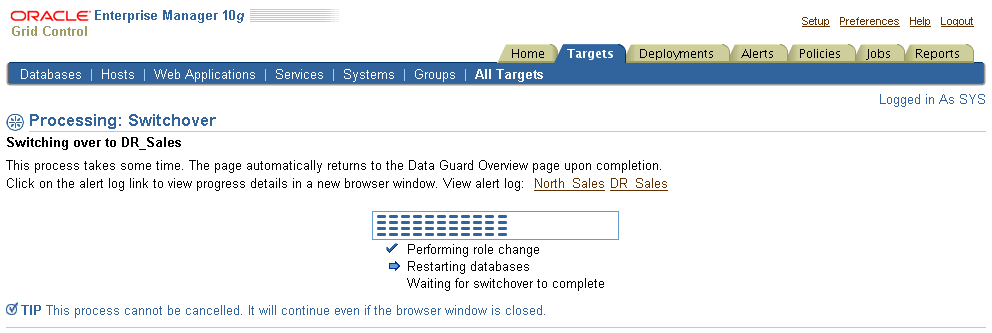
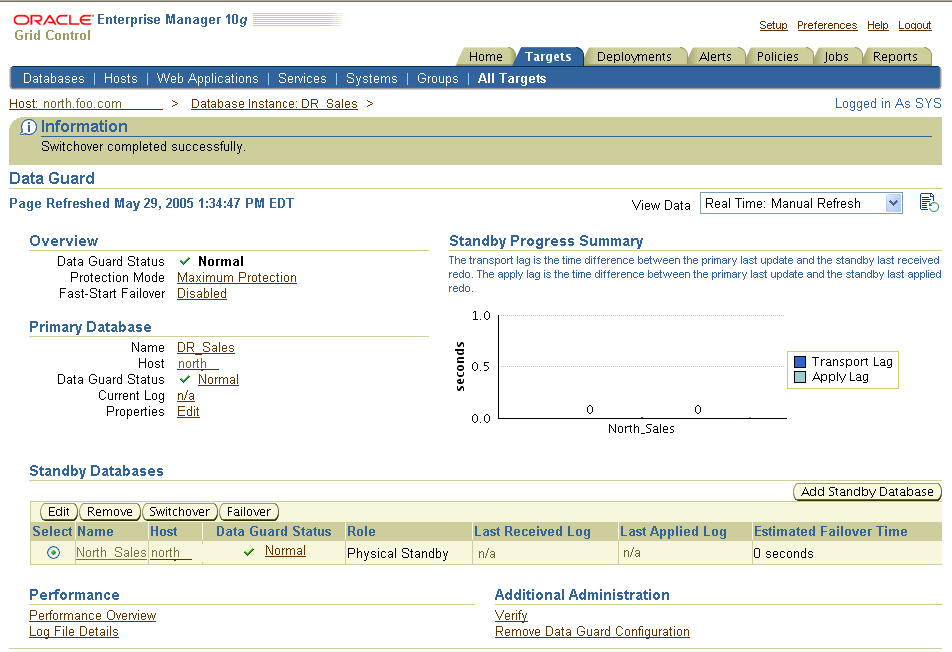
Figure 6-35 shows the Data Guard Overview page after a successful switchover.
Figure 6-35 New Primary Database After Switchover
This scenario steps you through the process of using the Failover operation to transition one of the physical standby databases, in this case DR_Sales, into the primary role. You should perform a failover only in the event of a software or system failure that results in the loss of the primary database. The failed primary database is disabled by the broker and must be reenabled, and the standby database assumes the primary database role. See Section 5.4.3 for steps to reenable the failed primary database as a standby database to the new primary database.
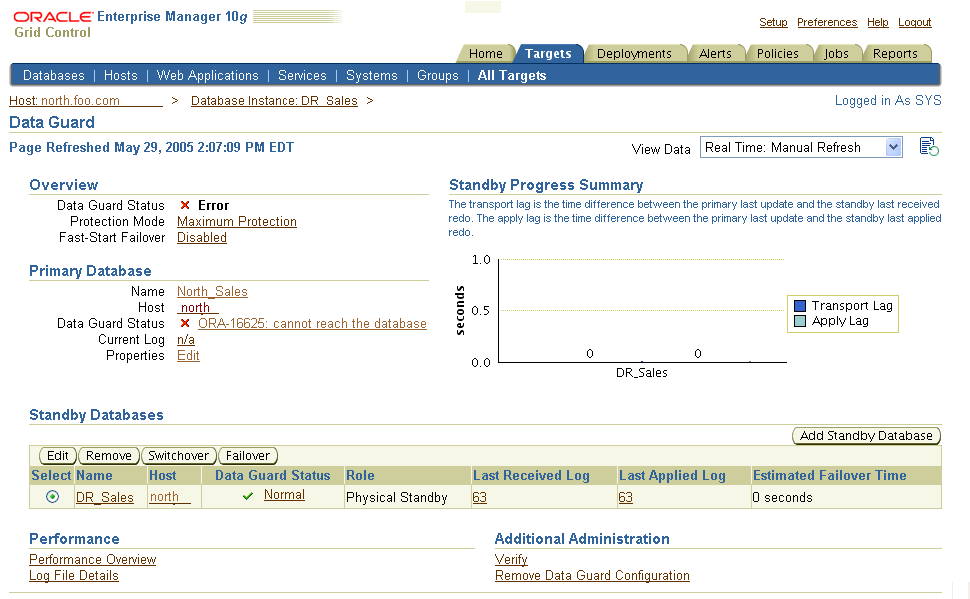
In Figure 6-36 the Data Guard Overview page shows the ORA-16625 error status that indicates problems accessing the primary database.
Figure 6-36 Data Guard Overview Page Showing ORA-16625 Error
To transition DR_Sales into the primary role, select DR_Sales in the Standby Databases table and click Failover.
Figure 6-37 shows the Failover Confirmation page.
If you determine that a failure occurred on the primary database and there is no possibility of recovering the primary database in a timely manner, you can start the Failover operation. In configurations with both physical and logical standby databases, Oracle recommends using the physical standby database as the failover target because it will allow the logical standby database to continue to function as a logical standby to the new primary database. If the failover is made to the logical standby, any physical standbys in the configuration will need to be re-created from a backup of the new primary database.
The Failover operation enables you to choose one of the following two types of failover operations:
Complete—attempts to minimize data loss by applying all available redo on the standby database.
Immediate—no additional data will be applied on the standby database; data may be lost. This is the fastest type of failover.
Figure 6-38 shows the progress of the failover operation.
During the failover, the selected standby database transitions into the primary role. If the failover target is a physical standby database, it is restarted. When completed, the Data Guard Overview page reflects the updated configuration, as shown in Figure 6-39.
Figure 6-39 Data Guard Overview Page After a Failover Operation Completes
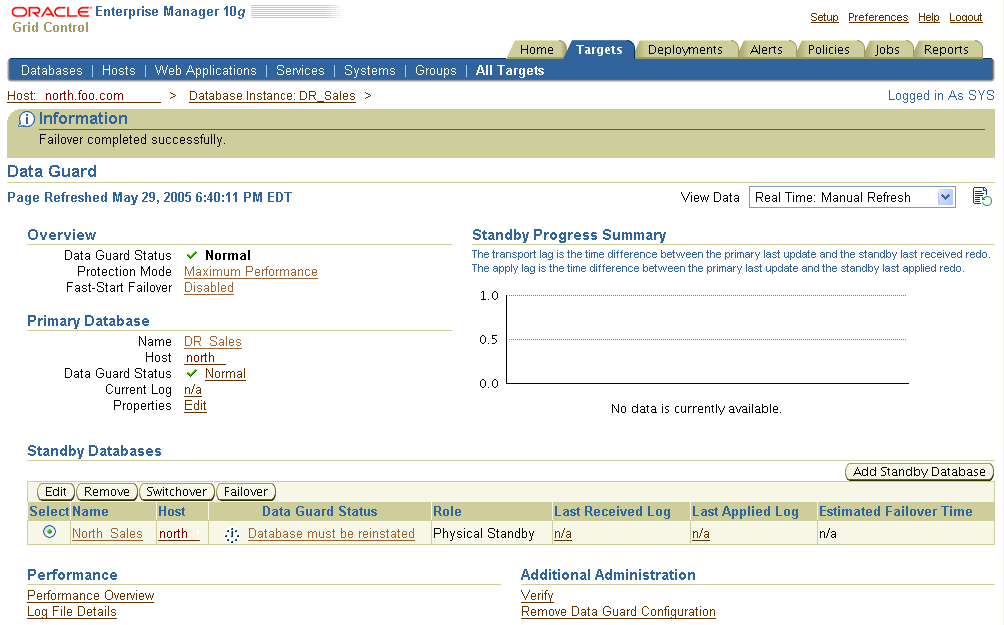
In the figure, the Data Guard Status column indicates that the original primary database (North_Sales) is disabled and can no longer be managed through Enterprise Manager until it has been reenabled as a physical standby database.
See Also:
Section 5.4.3 for more information about post-failover steps to reenable databasesEnterprise Manager provides ways to monitor the status of a configuration as well as the online redo log file activity of the primary and standby databases. At the most basic level, the Data Guard Overview page for the configuration not only displays information about the configuration, but it also includes summary information about its databases.
Note:
You can access the monitoring functions of Data Guard even if you are logged in as a non-SYSDBA user. However, all management features, such as standby creation, switchover, and failover, require a SYSDBA connection.For example, the summary information on the Data Guard Overview page shows the status for all of the databases in the configuration. If you want more information about why Redo Apply or SQL Apply are off for a specific standby database, select the Status link of the database in the Standby Databases table and view the property pages. Any Data Guard specific database properties that are incorrect, inconsistent, or known to be in conflict with other parameters will be flagged with a warning in the Edit Properties page for the database. A variety of icons indicating the status condition can appear next to the Status link. A green check mark appears if the primary database is functioning normally; a yellow triangle containing an exclamation mark appears if there is a warning; and a red X appears if there is an error condition.
To check the primary database status, select Status under the Primary Database section of the Data Guard Overview page.
To check the status of a standby database listed in the Standby Databases table, select the link under the Status column.
For example, a yellow warning icon may display the message "A yellow warning indicates an inconsistent property has been detected. The value for this property is inconsistent between Data Guard and the database, Data Guard and the server parameter file, or Data Guard and both the database and server parameter file."
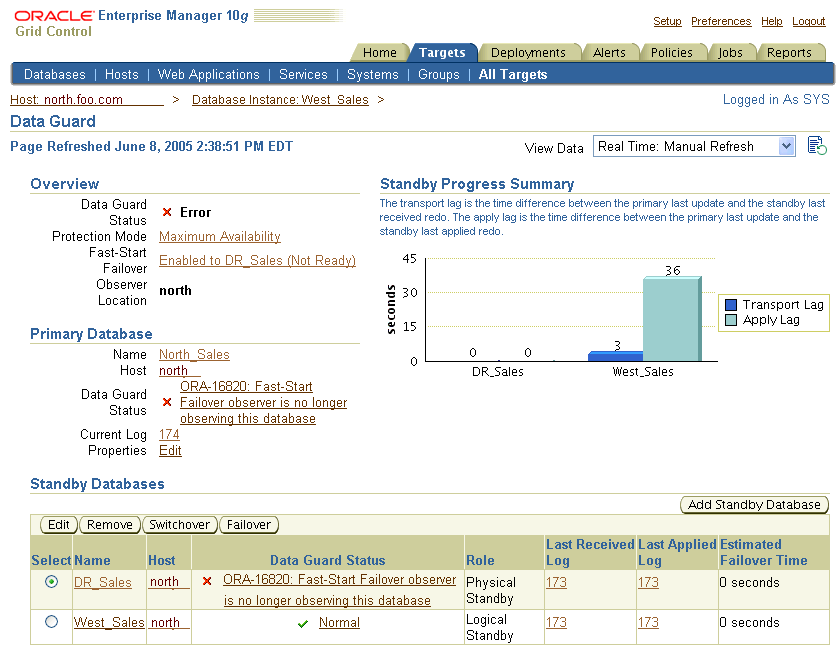
Figure 6-40 shows the Data Guard Overview page in the case where the configuration has returned an error because the observer is no longer observing the fast-start failover configuration.
Figure 6-40 Data Guard Overview Page Showing Observer Error
The following sections provide information on ways to monitor the status and health of a configuration:
Another way to quickly check the overall health of a broker configuration is to run the Verify operation. The Verify operation performs a series of validation checks on the broker configuration, including a health check of each database in the configuration. The checks include:
Shows the current data protection mode setting, including the current redo transport service settings for each database and whether or not the standby redo log files are configured properly. If standby redo log files are needed for any database, the Verify results will allow you to automatically configure them.
Validates each database for the current status.
Performs a log switch on the primary database and then verifies that the log file was applied on each standby database.
Shows the results of the Verify operation, including errors, if any. The Verify operation completes successfully if there are no errors and an online redo log file was successfully applied to at least one standby database.
Shows any databases or RAC instances that are not discovered. Undiscovered databases and instances could prevent a failover or switchover from completing successfully.
Detects inconsistencies between database properties and their corresponding values in the database itself. It also provides a mechanism for resolving these inconsistencies.
Note:
You can click Cancel at any time to stop the Verify operation.To verify the configuration, click Verify under the Additional Administration section of the Data Guard Overview page. See Figure 6-41. The Verify command displays a progress indicator. When the Verify operation completes successfully, the broker configuration is healthy, guarding the data, and ready for a switchover or failover.
When the Verify operation completes successfully, the broker configuration is healthy, guarding the data and ready for a switchover or failover operation. The Verify processing page can be canceled at any time.
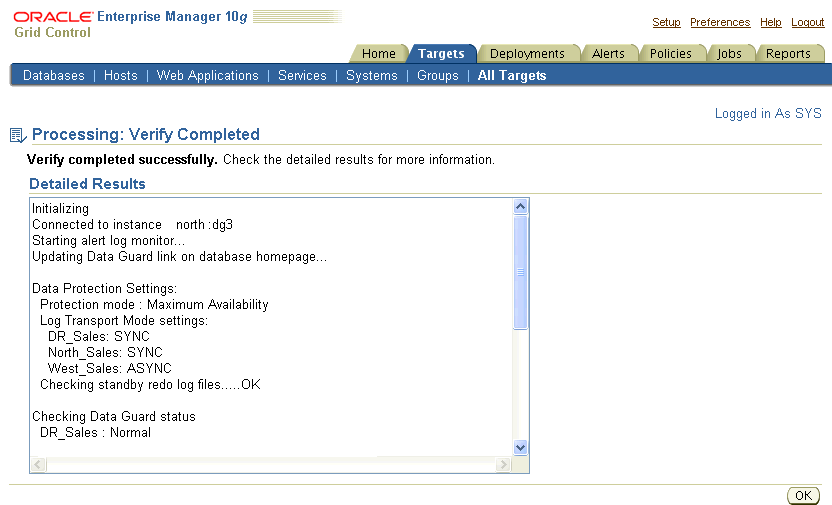
Figure 6-42 shows the results after the successful completion of the Verify operation.
Figure 6-42 Results of the Verify Command
For each standby database in the configuration, there is a table that shows the status of archived redo log files that were generated on the primary database but not received by the standby database, and for archived redo log files that were received but not applied to the standby database. This Log File Details page is useful to determine log file information when redo transport or log apply services are stopped. Under normal operations, each standby table is empty.
For example, if redo transport services go offline unexpectedly, the primary database continues to generate archived redo log files, but redo transport services will not send the archived redo log files to the standby databases. You can view the Log File Details page to find out which log files have not yet been received for each standby database.
On the Log File Details page, there is a Primary Current Log entry that indicates the log sequence number of the current log file on the primary.
For each standby database, redo transport and log apply information is displayed to help diagnose any log file buildup. Table 6-1 describes the columns for the standby table:
Table 6-1 Log File Details Page
| Column Title | Description |
|---|---|
|
Log |
The log sequence number. |
|
Status |
The status of the log file. |
|
Not Received |
The log file has not been received. |
|
Not Applied |
The log file has not been applied. |
|
First Change # (SCN) |
The first system change number. |
|
Last Change # (SCN) |
The last system change number. |
|
Size (KB) |
The size, in kilobytes, of the log file. |
|
Time Generated |
The time when the log file was generated. |
|
Time Completed |
The time at which the log file was completed. |
Click Log File Details from the Data Guard Overview page to see the page shown in Figure 6-43.
For more in-depth performance and monitoring, you can display detailed performance statistics for a broker configuration using performance charts that provide a graphical summary of all online redo log file activity in the configuration. The charts are refreshed based on a collection interval (the rate at which data is sampled from the primary database) that you can specify. The default collection interval is 30 seconds, which can be changed. See the online Help for detailed information about performance sampling rates.
The Performance Overview page collects performance related information from all of the databases in the configuration. All charts are represented by metrics. Typically, the charts show two hours worth of data. You can click any chart to view historical data (for example, 24 hours a day, 7 days a week, 31 days a month). Rates are calculated by determining the amount of redo (applied or generated) divided by the collection interval (default is 1 minute for the performance page, 5 minutes for metrics).
Redo Generation Rate -- This chart shows the redo generation rate (KB/sec) on the primary.
Lag Times -- Shows the Transport Lag (the approximate number seconds of redo not yet available on the standby database) and Apply Lag (The approximate number of seconds the standby is behind the primary database).
Apply Rate -- Displays the standby apply rate (KB/sec). The Current Redo Generation Rate shows the last value. The Apply Rate When Active value (last 3 logs, KB/sec) shows the actual apply rate when averaged over the last three log files.
Test Application -- The test application is a built in application which will generate a workload on the primary database. This is an easy way view the performance metrics when the primary database is under a load.
Overview -- Shows the primary database name and status. Click the status link to view the historical summary of the status metric. Note: the status on the performance page is shown directly from the status metric which runs at 5 minute collection intervals. The status on the Data Guard Overview Page is always updated on every refresh.
The Performance Overview page begins charting information as soon as the page is displayed. Data will not be collected for any offline or disabled databases.
Oracle Enterprise Manager automatically monitors the status and redo log file activity on the primary and standby databases. The following list shows the Data Guard metrics:
Data Guard Fast-Start Failover:
Fast-Start Failover Occurred
Fast-Start Failover SCN
Fast-Start Failover Time
Data Guard Performance
Apply Lag (seconds)
Estimated Failover Time (seconds)
Redo Apply Rate (KB/second)
Transport Lag (seconds)
Data Guard Status
You can set up Email Services to notify you through your e-mail if any of the metrics are triggered.
See Also:
Enterprise Manager help and documentation for more information about registering metrics and using Email ServicesThe following sections provide additional information about the Data Guard metrics.
When fast-start failover is enabled, these metrics will generate a critical alert on the new primary database (old standby) if a fast-start failover occurs.
The example in this section describes Data Guard metrics and how to set up for notification through e-mail when a metric is triggered. Take the following steps to manage Data Guard metrics:
Step 1 Set up to receive metric notification by e-mail.
You can set up the Notification Methods to notify you through e-mail if any of the metrics are triggered. To set up Notification Methods, take the following steps:
Click Setup at the bottom of the Database Home page.
Click Notification Methods on the Setup page.
Set up the required mail server information.
See Also:
Oracle Enterprise Manager documentation and help for a complete description of Email ServicesStep 2 View the All Metrics page.
You can view all of the metrics for Oracle Enterprise Manager, including Data Guard, by clicking All Metrics at the bottom of the Database Home page.
Figure 6-45 shows the All Metrics page for the primary database with the Data Guard metrics expanded.
Step 3 Set or change metric thresholds for Data Guard thresholds.
The following Data Guard metrics can be changed on the Metrics and Policy Settings page.
Data Guard Fast-Start Failover
When Fast-Start Failover is enabled, these metrics will generate a critical alert on the new primary database (old standby) if a fast-start failover occurs:
Fast-Start Failover Occurred: Indicates that a fast-start failover has occurred. The value is 0 if fast-start failover has not occurred, and 1 if fast-start failover has occurred.
Fast-Start Failover SCN: Shows the SCN when a fast-start failover occurred. The fast-start failover SCN must be initialized to a value before the metric will alert.
Fast-Start Failover Time: Shows the time when a fast-start failover occurred.
Data Guard Performance
All charts on the Performance Overview page are represented by the following metrics.
Apply Lag (seconds): Shows the approximate number of seconds the standby is behind the primary database.
Estimated Failover Time (seconds): The approximate number of seconds required to fail over to this standby database. This accounts for the startup time, if necessary, plus the remaining time required to apply all the available redo on the standby. If a bounce is not required, it is only the remaining apply time.
Redo Apply Rate (KB/second): Displays the Redo Apply Rate in KB/second on this standby database.
Transport Lag (seconds): Shows the approximate number seconds of redo not yet available on the standby database.
Data Guard Status
If the Data Guard Status metric contains Warning, a warning alert is triggered. If the metric contains Error, a critical alert is triggered.
See Also:
Oracle Enterprise Manager online Help for a information about setting metricsStep 4 View triggered metrics.
If a metric condition is triggered or a threshold value is exceeded, an alert is issued. Click Data Guard Status, Data Guard Performance, or Data Guard Fast-Start Failover on the All Metrics page to view triggered metrics.
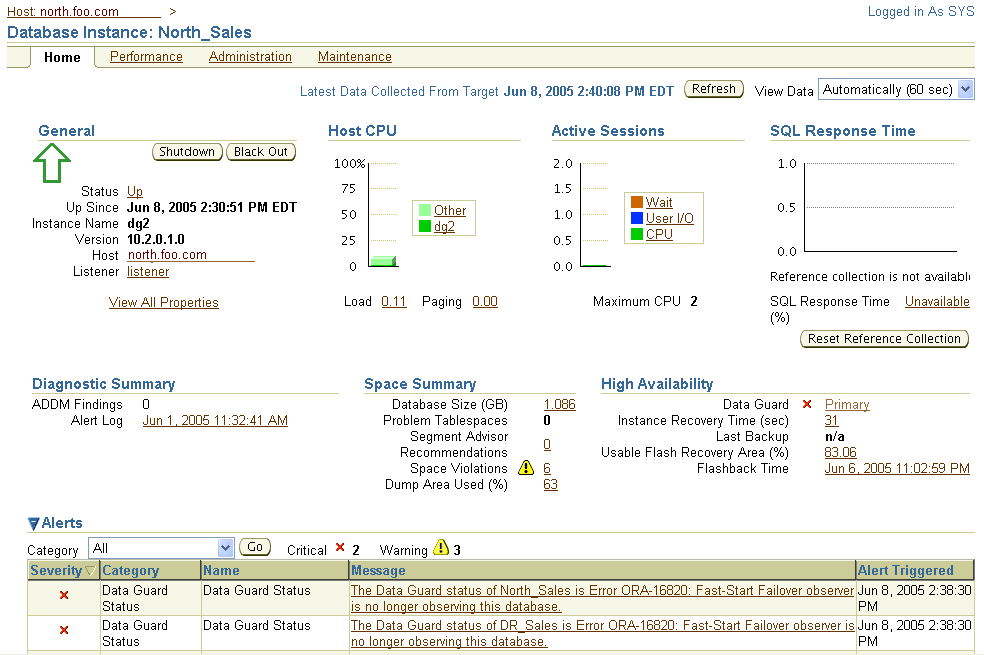
Figure 6-46 shows the Alert Log Errors page for the North_Sales database. It provides an example of what is shown when the Data Guard Fast-Start Failover metric triggers after a problem with the observer is detected in the configuration. The table shows the status of each database in the configuration. The status of the primary database shows the ORA-16820 error.
Figure 6-46 Alert Log Errors Page Showing the Observer Has Stopped
Because Email Services was set up, DBAs are also notified by an e-mail message.
After a metric condition is fixed, the metric is cleared automatically.
You can remove a standby database or broker configuration so that it is no longer controlled by the Data Guard broker.
Removing a standby database from Data Guard broker control does not permanently delete the database itself. This operation permanently removes the profile of the standby database from the broker configuration file.
By default, the standby destination is also removed from the primary database so that log files are no longer archived to that standby database.
Caution:
The Oracle9i Data Guard Manager default was to preserve the standby destination on the primary database.
To remove a standby database from the broker configuration, click Remove in the Standby Databases section of the Data Guard Overview page. Enterprise Manager will ask you to confirm that you really want to remove the standby database from the configuration. Click Yes to continue or No to cancel.
Figure 6-47 shows removing a standby database.
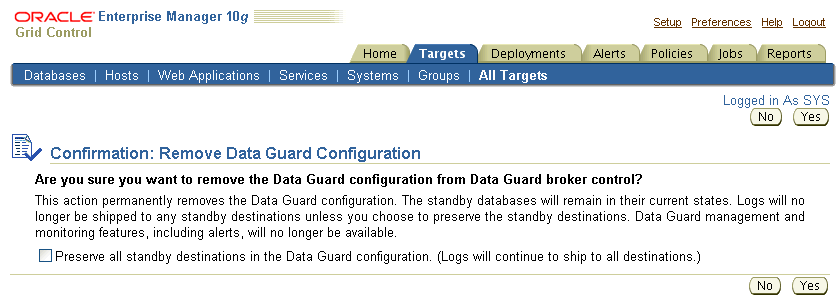
To remove the broker configuration, you must be connected to the configuration through the primary database. Click Remove Data Guard Configuration under the Additional Administration section. Enterprise Manager will ask you to confirm that you want to remove the configuration. Click Yes to continue or No to cancel.
Figure 6-48 shows removing a Data Guard broker configuration.
Figure 6-48 Removing a Data Guard Broker Configuration
When you choose this option, Enterprise Manager removes (deletes) the selected broker configuration permanently. When you permanently remove a configuration, the remove operation:
Does not affect the underlying operations of the standby databases or log apply services if you check the box to preserve all standby destinations. Operations such as redo transport services and log apply services continue to run; however, these services are no longer manageable through Enterprise Manager.
By default, all standby database profiles are removed from the broker configuration, and redo transport services to all standby databases in the configuration are stopped.
Destroys all broker configuration profile information maintained for each database; the configuration is then unknown to the broker and can no longer be managed from Enterprise Manager.
Although the configuration information is not recoverable once you delete a broker configuration permanently, you can easily re-create the configuration with the Add Standby Database wizard.
Footnote Legend
Footnote 1: This documentation uses Enterprise Manager to refer to the Grid Control Web-based user interface for managing Data Guard broker configurations.